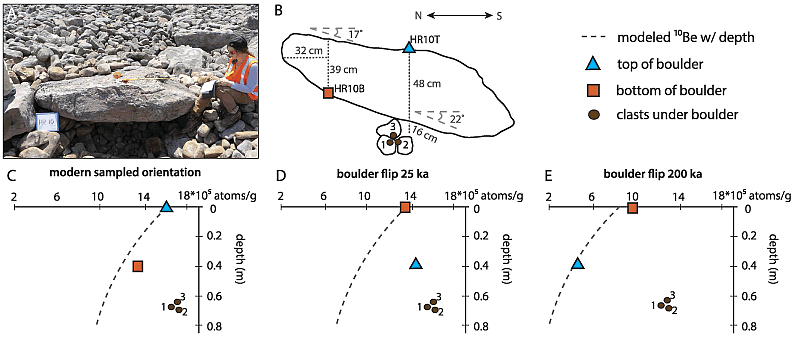
Figure 2.
Measurement of boulder HR10 and underlying clasts. (A) Photograph of boulder HR10 on top of clasts; (B) side view of HR10 samples and underlying clasts; (C) 10Be production decreases exponentially with depth. The black dashed line represents the 10Be concentrations expected in HR10B and samples 10C1–C3 if they remained in place at depth for their entire histories. (D) Depth profile assuming the boulder flipped 180 ° at 25 ka—the concentration in HR10T is too high to have flipped then. (E) Sample HR10T aligns with the depth profile assuming the boulder flipped at 200 ka.