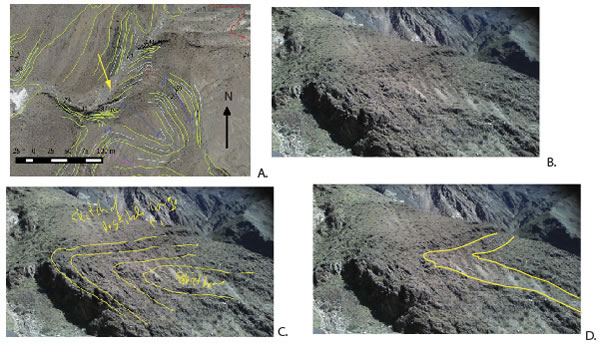
Figure 4.
Sequential development of the structural interpretation for the area in Figure 2D–2F. (A) shows field map at the end of the first season (one field day) with contradictory interpretations. Yellow arrow shows view direction in Figure 2 and (B)–(D) in this figure. (B) shows an uninterpreted field image captured on a tablet computer with the same image annotated in (C) showing the field interpretation after the second visit to the site versus the final interpretation (D) developed from model interpretation and a field visit to confirm the interpretation. Linework in (A) shows form lines of layering (green), main foliation (blue), inferred second cleavage (dashed thin red lines), intrusive contacts (magenta), and fault contacts (dashed red line).