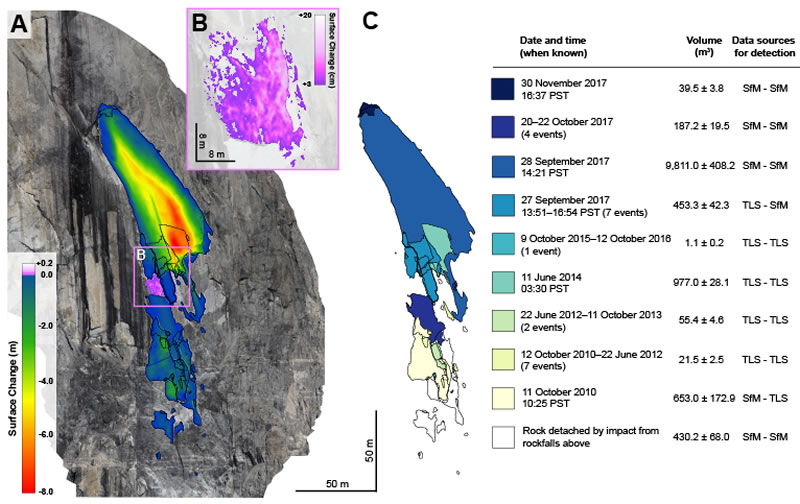
Figure 2.
Spatial and temporal progression of rockfalls from the southeast face of El Capitan between Oct. 2010 and Nov. 2017. (A) Structure-from-Motion (SfM) model with color overlay showing the spatial progression of rockfalls, derived by comparing SfM models against earlier terrestrial laser scanning data (TLS). Negative surface change represents rockfall thicknesses; positive surface change, shown in (B), represents outward displacement of a rock sheet by up to 20 cm. (C) Temporal progression of rockfalls occurring between Oct. 2010 and Nov. 2017.