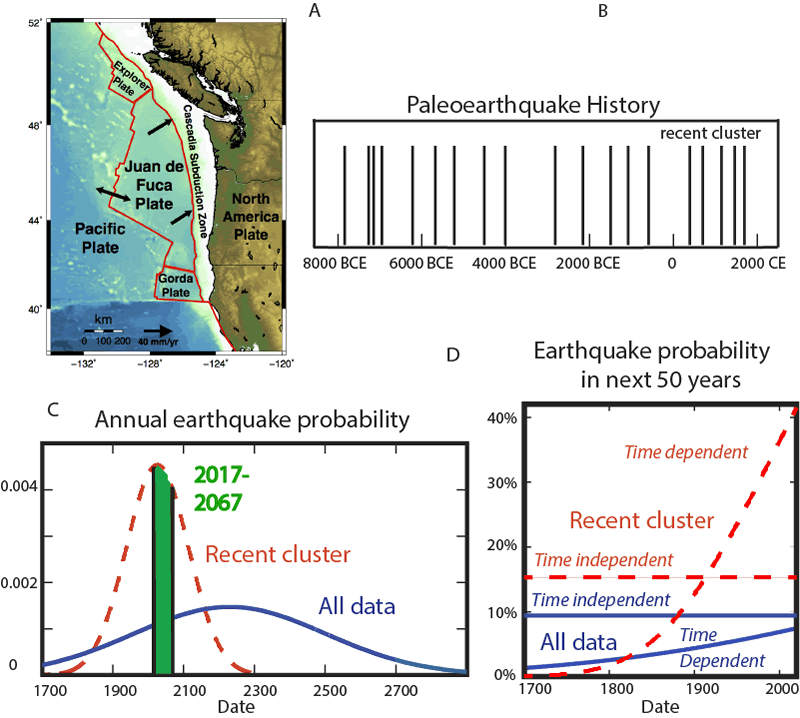
Figure 1.
(A) Geometry of the Cascadia subduction zone. (B) Paleoearthquake history from turbidite deposits. (C) Probabilities of an earthquake in the next year as a function of time assuming a Gaussian distribution of recurrence times with mean and standard deviation corresponding to the recent cluster (red/dashed lines) or the entire paleoearthquake record (blue/solid lines). Shaded area under the curves corresponds to the probability in next 50 years. (D) Conditional probability of an earthquake in next 50 years, given that last was in 1700, for the four cases discussed.