Figure 4.
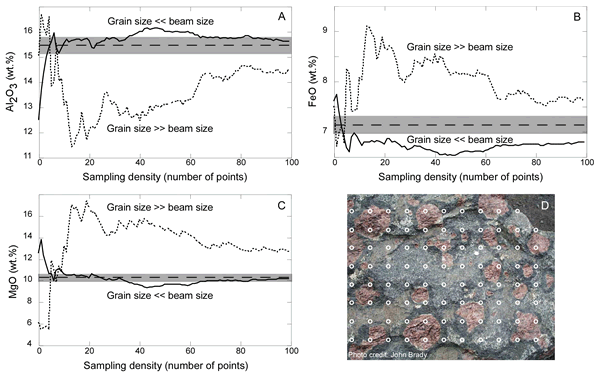
Comparison of sampling number with modeled bulk compositions. Solid line represents grain size << beam size; dotted line represents grain size >> beam size; dashed line is the true electron probe microanalysis oxide value. Modeled and true bulk values are approached within ~10 analyses for fine-grained samples (solid line) with larger beam spot sizes. Significantly more analyses are needed when the sample is coarse-grained (dotted line). (A) Al2O3. (B) FeO. (C) MgO. (D) Gore Mountain garnet outcrop. Circles represent the 1.5 cm diameter of possible Raman or laser-induced breakdown spectroscopy analytical dimensions. Note the difficulty in sampling a representative bulk composition even at these relatively large analytical sizes in a coarse-grained material. For comparison, with a 2 µm diameter beam size, 7,500 electron probe microanalysis or X-ray absorption spectroscopy spots would fit the diameter of each individual circle; for a 0.2 nm diameter beam size, 75,000,000 electron energy loss spectroscopy spots would fit the diameter of each individual circle.