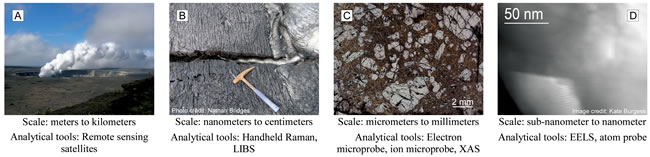
Figure 1.
Comparison of geoanalytical scale. (A) Halemaumau crater, Kilauea, Hawaii. Photo by Molly McCanta. (B) Lava flow features, Kilauea. Photo by Nathan Bridges. (C) Photomicrograph of basaltic magma from Kilauea Iki lava lake. Photo by Molly McCanta. (D) Scanning transmission electron microscopy–electron energy loss spectroscopy (STEM-EELS) large grayscale high-angle dark field image of basaltic glass. Brighter areas show where iron is concentrated; bottom left corner shows the sample edge. LIBS—laser-induced breakdown spectroscopy; XAS—X-ray absorption spectroscopy.