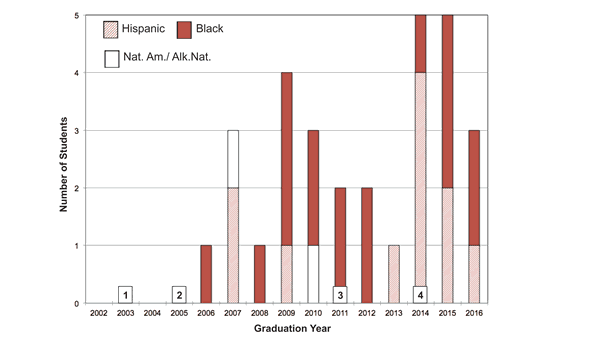
Figure 1.
Student diversity by graduation year. Only the number students who identified as being from one of the NSF-defined diversity groups are shown on the y axis. Numbers for students who identified as white, mixed race, Asian, or unknown are not included. Numbers on the x axis refer to departmental changes: 1—hired Asian-American professor; 2—started senior seminar; 3—started sophomore seminar; 4—hired Hispanic professor. Tenure-track faculty composition, 2001–2002: two women (1 white, 1 black) and four men (all white); 2015–2016: 2 women (1 white, 1 black) and 6.5 (half appointment in another dept.) men (4.5 white, 1 Asian, 1 Hispanic). Number of graduates varies from 8 (2004) to 24 (2015). Nat. Am.—Native American; Alk. Nat.—Alaska Native.