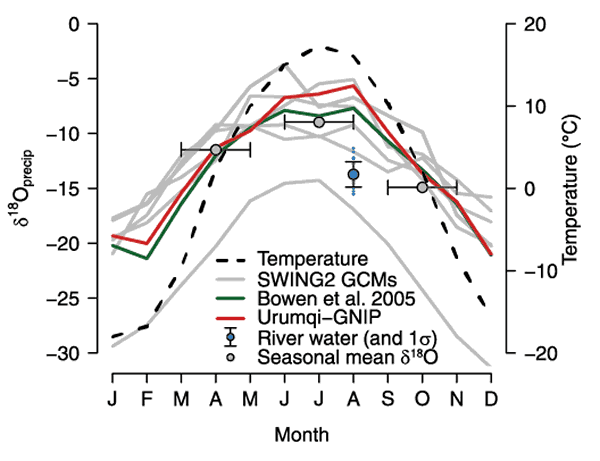
Figure 3.
Average δ18Op and surface air temperature (black, dashed line) (Mitchell and Jones, 2005) in the Zaysan Basin during the year. Gray lines—SWING2 general circulation model (GCM) experiments (Risi et al., 2012); gray points—precipitation-weighted seasonal δ18Op as estimated from the SWING2 data; dark green line—Online Precipitation Isotope Calculator (Bowen et al., 2005); red line—precipitation-weighted monthly means of δ18Op from the Urumqi Global Network of Isotopes in Precipitation (GNIP) site (IAEA/WMO, 2016); blue points—measured stream water δ18O in Kazakhstan.