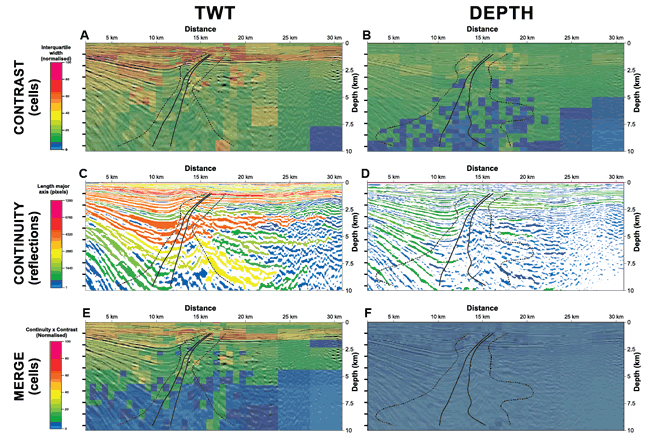
Figure 2.
Results of the analysis carried out in two-way travel time (TWT) (A, C, and E) and depth (B, D, and F) seismic sections with the respective fault spread superimposed (outlier limits marked with dashed lines; quartiles 1 and 2 marked in continuous lines). (A) and (B) contrast analysis—warm colors represent high values in interquartile difference (i.e., high contrast) and cold colors represent low values (i.e., low contrast). (C) and (D) continuity analysis—reflections colored according to the length of their major axis, with warm colors indicating long lengths (i.e., high continuity) and cold colors short length (i.e., low continuity). (E) and (F) merge of the two analyses—the results have been combined in a 1:1 relation; that is, the contrast and continuity values have been multiplied and normalized to 100. Note that the TWT results have been depth-converted for comparison (i.e., located at the same point) to the depth results. The black lines at the left side of the images mark the depths of the nine positions at which the fault placement for the interpretation populations was computed in each seismic image.