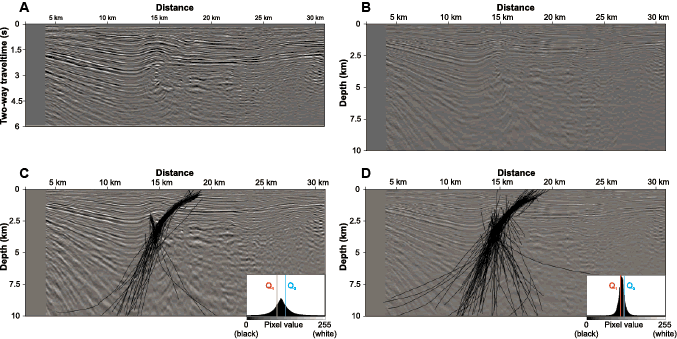
Figure 1.
Seismic sections used in the interpretation experiment. (A) Seismic section in two-way travel time (TWT). (B) Seismic section in depth. (C) and (D) stacked results of the interpreted faults in TWT and depth (respectively). The figure includes the histogram of the corresponding section. In the histograms, the x-axis represents the possible gray values (from 0-black to 255-white) and the y-axis the number of pixels found for each value. Note that the sections conserve the vertical scale in which they were presented to the participants and that the results in TWT were converted to depth, to be comparable with those interpreted in the depth section. The sections are courtesy of BP/GRUPCO. Q1 and Q3—first and third quartiles.