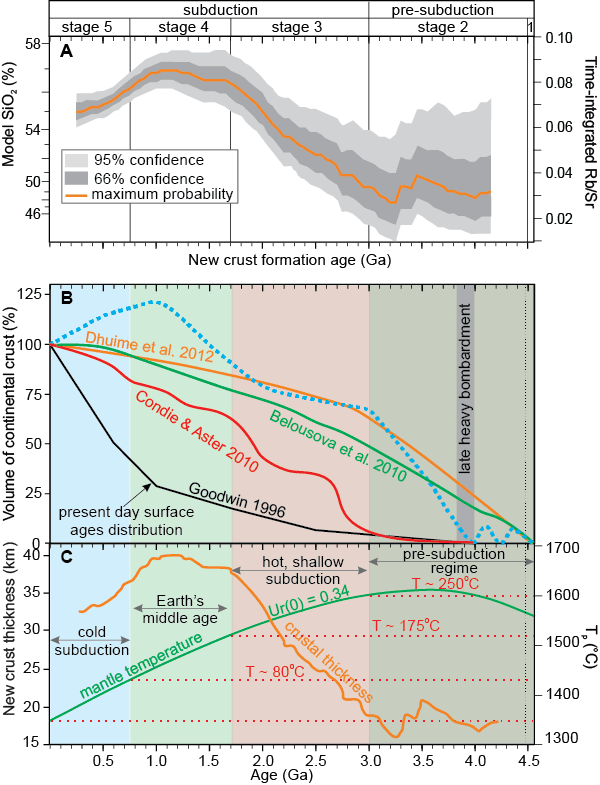
Figure 4.
(A) Variation in the estimated Rb/Sr ratios, and SiO2 contents, of new continental crust from Dhuime et al. (2015). (B) A preliminary model for the changes in volume of the continental crust (dotted blue curve) compared with the crustal growth curves of Belousova et al. (2010) and Dhuime et al. (2012), the model age distribution of Condie and Aster (2010), and the present-day surface age distribution of Goodwin (1996). The preliminary model is illustrative, and it is not unique. It assumes two types of crust generated before and after 3.0 Ga, and rates of crust generation and destruction for each. It is constrained by the volume of continental crust at the present day and 70% at 3.0 Ga, and by the present-day curve of Condie and Aster (2010). (C) Variation in the thickness of new continental crust through time (orange curve) as estimated from the Rb/Sr ratio of new continental crust (Dhuime et al., 2015), and thermal models for ambient mantle for Urey (Ur) ratio of 0.34 (Korenaga, 2013).