
Page 5 - gt1607
P. 5
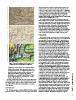
Figure 1. Stages in the compilation of William Smith’s 1815  documented his observations; he would not have used it in the             GSA TODAY | www.geosociety.org/gsatoday
          Geology map by John Cary (showing part of Wiltshire).        field because the scale was too small. Smith did make an early
                                                                       experiment using a Cary one-inch to twenty-mile (~1:1,300,000)
     supplied by a map that gives, in one view, the locality of        map, but he said that the “maps were spoiled by speculating on the
     thousands of specimens. By strong lines of colour, the            ranges of stratification without sufficient data” (Smith, 1815,
     principal ranges of strata are rendered conspicuous, and          p. 27). His memoirs also record that he colored a map in the
     naturally formed into classes, which may be seen and              vicinity of Bath and also used the Day and Masters County Survey
     understood at a distance from the map, without                    of Somerset (1782) (Phillips, 1844, p. 27).
     distressing the eye to search for small characters. This is
     the advantage of colours over any other mode of repre-              In the early nineteenth century, scale adjustment was more
     sentation. (Smith, 1815, p. 11)                                   difficult but not insurmountable. In order to scale his field maps
  The effect of Smith’s striking coloring technique also serves        onto the 1815 base map, Smith would almost certainly have used a
to give added depth to the two-dimensional plane of the map:           pantograph. Smith was very familiar with this instrument. In his
the individual strata appear to have a measure of three-dimen-         journal entry for Friday, 18 December 1789, Smith records time
sional relief, which makes their relationship to one another           spent “Repairing and Setting the pentograph [pantograph]”
more apparent.                                                         before he “began to reduce the Plan of a Mr. C. Norton’s allot-
                                                                       ments” (OUMNH Archive, Diaries, WS/B0 p. 55). It is important
MAPPING SCALE                                                          to realize that although Smith’s final map may have been small
                                                                       scale, its content was derived from his large-scale field maps.
  The 1815 map measures more than eight feet by six feet and was
printed on 15 sheets. This map was the canvas upon which Smith         PROJECTIONS

                                                                         Smith would not have been overly concerned about the projec-
                                                                       tion of his base map; however, projections are a crucial element of
                                                                       any Geographic Information System (GIS). Projection informa-
                                                                       tion does not appear on any Cary or Smith map. The graticules
                                                                       around the margins of the maps show ticks of longitude and lati-
                                                                       tude (usually based on the Greenwich meridian), but in most
                                                                       cases there are no internal coordinate lines/ticks within the body
                                                                       of the map. On the Cary Turnpike map, the latitude degree ticks
                                                                       are angled to the frame, indicating that parallels may be curved
                                                                       lines. Meridians may or may not be straight, but in all cases are
                                                                       not parallel. However, although only a small-scale map, the
                                                                       General Index Map for Cary’s 1794 New Map of England and
                                                                       Wales and Part of Scotland does have internal longitude and lati-
                                                                       tude lines. Some information is available regarding commonly
                                                                       used late eighteenth-century and early nineteenth-century projec-
                                                                       tions. John Snyder gives a good account of these projections
                                                                       (Snyder, 1993); his list of projections was tested on the Smith and
                                                                       Cary maps used in the GIS. First-order polynomial transforma-
                                                                       tion (affine) was used to project map images to coordinates for
                                                                       each of the tested projections. Residual (RMS) errors were calcu-
                                                                       lated based on the framing graticules. Typical errors ranged from
                                                                       >4,500 m (14,764 ft) to <1000 m (3281 ft). Some projections (e.g.,
                                                                       Lambert Azimuthal Equal Area) achieved a good fit on the grati-
                                                                       cule but had a considerably distorted shape. Apart from the
                                                                       residual errors on the graticules, a judgment also had to be made
                                                                       on the fit to places and coastlines. In this regard, it is worth
                                                                       remembering that the maps are all about 200 years old.
                                                                       Essentially, they predate the 1st Principal Triangulation of the
                                                                       country, which started in 1783 and was not completed until 1853
                                                                       (although the first phase was complete by 1796). Although the
                                                                       general shape of England and Wales is excellent on all maps, it
                                                                       does differ from the modern coastline. For example, the Cary and
                                                                       Smith maps show the position of Lands End to be >4 miles north
                                                                       of its actual position; similarly, the Isle of Man is offset by ~8 miles
                                                                       to the northeast. Bonne, Cassini, and Transverse Mercator projec-
                                                                       tions all achieved relatively good results. Bonne was marginally
                                                                       the best fit on the Smith 1815 map, closely followed by Cassini
                                                                       (used by the Ordnance Survey for the Old Series 1� maps of

                                                                                                                                                 5