
Full Text View
Volume 26 Issue 1 (January 2016)
GSA Today
![]()
Article, pp. 4-10 | Abstract | PDF (635KB)
The world is changing
| Table of Contents |
|---|
|
Search GoogleScholar for
Search GSA Today |
GSA 2015 Presidential Address
The world is changing. Our science is increasingly global, as we recognize the challenges of understanding interconnected Earth systems, meeting the rising global demand for mineral and energy resources, handling tradeoffs regarding sustainable development, and reducing the risks of natural disasters that impact the global economy. The geosciences are vital to meeting these societal challenges. The future is bright for the geosciences, from many perspectives.
doi: 10.1130/GSAT-15PresAdrs.1
Demand is high for nearly every mineral and energy resource. This high demand provides many opportunities for geoscientists to contribute throughout the life cycles of these resources (from exploration and mining to reclamation and recycling) and to continually improve environmentally responsible and economically sustainable extractive activities.
Global production of copper (Fig. 1) illustrates the high demand. Copper is vital in modern society, primarily as a conductor of electricity. Demand is high in part because the world population continues to rise and in part because per capita consumption is also rising (illustrated in Fig. 1 as annual mine production divided by population). More people want the conveniences that electricity provides—lighting, heating, motors, refrigerators, computers, etc. Since 1900, world population has increased approximately four-fold, whereas copper production has increased by a factor of 38, and per capita consumption has risen nine-fold. Although some ups and downs (due to recessions and wars) in production are apparent, the trends are clearly toward more copper mined and more use per person each year.
|
Annual global copper production, 1900–2014 (production data from U.S. Geological Survey and U.S. Bureau of Mines; population data from U.S. Central Intelligence Agency; updated from Price, 2013). |
 Figure 1
A somewhat similar situation is illustrated by gold production (Fig. 2). Although gold has many industrial uses (vital for conducting electricity in computers and cell phones and in reflecting heat), its primary use is as money, either in the form of bullion, coins, or, in much of the world, jewelry. Since 1900, gold production has increased by a factor of seven, and per capita consumption has fluctuated but overall increased by a factor of about two.
|
Annual global gold production, 1900–2014 (production data from U.S. Geological Survey and U.S. Bureau of Mines; population data from U.S. Central Intelligence Agency; updated from Price, 2013). |
 Figure 2
Mine production of gold in 2014 reached the historically high amount of 2,860 metric tons, according to the U.S. Geological Survey (2015). For the geological community, this is a staggering amount. In comparison, the Carlin trend in Nevada (Fig. 3), one of the top gold-mining areas in the world, has produced ~2,500 metric tons of gold (worth approximately US$100 billion at last year’s average price) in its entire history (including modern-day production after the discovery of the Carlin deposit in 1961). Assuming that mine production, from hundreds of mines throughout the world, continues at this rate, geoscientists will need to find the equivalent of at least one new Carlin trend each year to keep up with global demand.
|
Photograph of the Carlin East pit and portal in 2000, Newmont Mining Corporation, Nevada, USA. |
 Figure 3
We are in the midst of the biggest gold-mining boom in history, both globally (Fig. 2) and in the United States (Fig. 4). The current boom has exceeded previous booms in terms of total production, peak annual production, and longevity. Yet the world of gold mining has changed. For decades the Witwatersrand in South Africa dominated global gold production, but in 2007, China overtook South Africa to become the number 1 producer (Fig. 5). China is the world’s most populous country, with 19% of the global population (Fig. 6), and if one assumes even geographic distribution of mineral resources, one might expect China to produce roughly 19% of most commodities. China’s growth in the last decade has been dramatic. To meet its demand for mineral resources needed for domestic infrastructure, domestic consumption, and exports of products, China far exceeds 19% of global production for many mineral commodities (Fig. 6). That is, the world of mining has changed, with China far exceeding other countries in production.
|
Gold production in the United States and in Nevada, 1835–2014 (data from Dobra, 2002, U.S. Geological Survey, U.S. Bureau of Mines, and Nevada Bureau of Mines and Geology; updated from Price, 2013). |
 Figure 4
|
Annual gold production by major producing countries, 1930–2014 (data from U.S. Geological Survey and U.S. Bureau of Mines; updated from Price, 2013). |
 Figure 5
|
Most populous countries and China’s percentage of global production for selected commodities (data from U.S. Geological Survey, U.S. Department of Energy, and U.S. Central Intelligence Agency; EU—European Union; updated from Price, 2013). |
 Figure 6
China also leads the world in coal production, with 46% of the global total in 2013. Like most of the other mineral resources, global annual coal production has been rising in recent years (Fig. 7), largely due to China’s demand. Coal is used primarily in the generation of electricity, but metallurgical coal is also used in the production of steel, for which China produced 50% of the global supply in 2014. Annual global coal production (~7.8 billion metric tons in 2013) is significant in terms of both impacts to the land and to the atmosphere. Assuming an average coal-seam thickness of 3 m (Fig. 8), the global amount of coal production would cover an area of ~1860 km2. There are indications that China is slowing down its coal production, in part due to the health hazards of air pollution. With changing technology in energy production, it is likely that we will one day see a peak in coal production, much like the peak in flint production (Fig. 9), which was caused by technological advances.
|
Annual global coal production, 1900–2013 (production data from U.S. Department of Energy and World Coal Association; population data from U.S. Central Intelligence Agency). |
 Figure 7
|
Coal seams near Healy, Alaska, USA, 1999. Seams as thick as 3 m are not uncommon in better coal fields. |
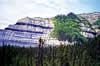 Figure 8
|
Estimated world population and production of flint over time, illustrating peak flint production (from Price, 2013). |
 Figure 9
Climate is changing, with many opportunities for geoscientists to contribute to mitigation and adaptation. It seems clear that the burning of coal and other fossil fuels is contributing to the observed rise in CO2 in the atmosphere (Fig. 10). As estimated from the calculation below, the amount of CO2 released from burning of coal in 2013 would have been enough, even with natural reduction from plant growth, rain, and other processes, to raise the concentration of CO2 in the atmosphere by ~2.9 parts per million by volume (ppmv), a bit more than the recent global trend of CO2 increasing ~2 ppmv per year.
|
Rising CO2 in the atmosphere (from National Oceanic & Atmospheric Administration, 2015). |
 Figure 10
(7.823 × 10¹⁵ g coal burned in 2013) × (~0.8 g C/g coal) × (3.6642 g CO2/ g C)/(5.15 × 1021 g air in the atmosphere) × (28.97 g air)/(mole air) × (1 mole CO2)/(44.0095 g CO2) × 106 ppmv CO2/(mole CO2/mole air) = ~2.9 ppmv CO2 potentially added to the atmosphere
Geoscientists will have opportunities to contribute to mitigation through exploration and development of the mineral resources needed for renewable and carbon-minimal energy production and more efficient use of electricity. Examples include uranium and thorium for nuclear power; neodymium, iron, and boron for high-strength magnets in wind turbines; and terbium and europium in highly efficient fluorescent light bulbs. Geoscientists will also contribute to safe disposal of waste from energy production, including evaluating the safety of nuclear waste repositories and injection of CO2 in permeable strata without generating damaging earthquakes.
As all geologists know, the world is literally changing. Plate tectonics slowly moves the ocean floors and continents. Erosion sculpts the landscape. Volcanism modifies climate. What has changed, though, in my lifetime, is that we are now measuring many of the changes directly. With the advent of the global positioning system (GPS), we are now able to accurately measure how the world is changing, with a myriad of applications from basic science to natural hazards. We are able to directly measure tectonic rates of change (Fig. 11), which are increasingly being used in earthquake-hazard assessment and communication to the public (Figs. 12 and 13). Such communication is slowly helping to improve building codes and limit losses from collapse of unreinforced masonry buildings during earthquakes (Fig. 14). As technology evolves, we can expect many new discoveries and exciting new applications in geology.
|
Global strain-rate model derived from over 22,000 horizontal GPS velocities; white areas assumed to be rigid plates (figure courtesy of Corné Kreemer, modified from Kreemer et al., 2014). |
 Figure 11
|
Geodetic strain in part of the western United States, information that is used, along with seismic and neotectonic data, in earthquake-hazard assessment and communication of hazard information to the public (warmer colors and longer arrows illustrate areas of relatively higher strain; figure from Kreemer et al., 2012). A full-size copy of this map is available at http://pubs.nbmg.unr.edu/Geod-strain-rate-full-size-p/m178.htm. |
 Figure 12
|
The U.S. Geological Survey integrates neotectonic (fault), earthquake, and geodetic data into its probabilistic seismic hazard analysis, which, in turn, is incorporated into model building codes. Image from U.S. Geological Survey (2014). |
 Figure 13
|
Front (left) and back (right) of an unreinforced masonry (URM) building damaged in the 21 Feb. 2008 Wells earthquake in Nevada, USA. |
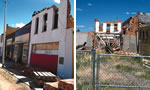 Figure 14
The demographics of our science have evolved. Not only is the world changing, but we geoscientists are changing as well (Fig. 15). The American Geosciences Institute’s Workforce Program (Wilson, 2014) reported on recent gains among women in all college majors (Fig. 16) and in the geosciences (Fig. 17). The representation of women in the geosciences is approaching, but not quite at, the percentage in the population (at least in the U.S.). We have a long way to go, however, in terms of minorities in the geosciences (Fig. 18). Also, few statistics are available on the percentage of individuals with disabilities within our profession. To attract the best and brightest to our profession, we must have attractive career paths and opportunities for all people. I’m pleased that GSA actively supports opening the profession to all, through such programs as On To the Future, which is bringing students from underrepresented groups to our annual meetings.
|
Illustration of the evolution of the modern geologist, Geo sapiens (graphic courtesy of Opal Adams, Enviroscientists). |
 Figure 15
|
Percentage of degrees granted to women by degree level, all majors (illustration courtesy of the American Geosciences Institute; from Wilson, 2014). |
 Figure 16
|
Participation of women in geoscience programs (illustration courtesy of the American Geosciences Institute; from Wilson, 2014). |
 Figure 17
|
Percentage of underrepresented minorities in geoscience and other science and engineering occupations (illustration courtesy of the American Geosciences Institute; from Wilson, 2014). |
 Figure 18
Our profession is changing. Neuendorf et al. (2005) defined geology as “the study of the planet Earth, the materials of which it is made, the processes that act on those materials, the products formed, and the history of the planet and its life forms since its origin.” They also defined geologist as “one who is trained in and works in any of the geological sciences.” I am somewhat disappointed about the evolution of the terminology for geologists. What was once broadly labeled as a geologist became a “geological scientist,” presumably partly to not offend some geophysicists and geochemists. We also use the term “Earth scientist,” but that might offend some planetary scientists. We now promote the term “geoscientist.” I actually prefer the label “geo.” In the international mining business, geos include geophysicists, geochemists, structural geologists, economic geologists, mineralogists, sedimentologists, stratigraphers, paleontologists, volcanologists, petrologists, environmental geologists, geological engineers, geotechnicians, etc.; and they work with biologists and other scientists, engineers, skilled laborers, and community-relations and business professionals to benefit society.
GSA has Divisions, but we work together on our mission to advance geoscience research and discovery, service to society, stewardship of Earth and the geosciences profession. Perhaps the word Division isn’t the best term. It implies that we are divided, when so many of our issues, such as mining in an economically and environmentally acceptable manner, require multidisciplinary approaches. Maybe we need to change the name from Divisions to something else. Multiplications doesn’t make sense, nor does Exponentials, but along those lines, perhaps Dimensions could be better. The string-theory physicists have about 10 dimensions. We have at least 18, the current number of GSA divisions (GSA18), or 20, if you add the Soils and International Interest Groups (GSA20), or 90+, if you add the Associated Societies and their disciplinary, professional, and geographic dimensions (GSA90+).
GSA’s world is changing as well. A huge change, which will benefit our members, authors, the general public, and science, is the fact that our journals will be freely accessible on the Web upon publication, with Geology first in 2017.
Let’s envision GSA and our science in the future journals. GSA publications will continue to be rigorously peer reviewed and edited. GSA publications will attract many of the best papers, books, and maps in the geological sciences. Electronic access will be available anywhere—in the office, lab, or field. We might even expect that the public will make sound decisions on the basis of our science. GSA publications will be accessible to everyone, and we will attract the best and brightest students from diverse backgrounds, thereby increasing the likelihood of meeting societal challenges.
Technological advances in such areas as multiple sensors on airborne drones, submersibles, and vehicles on other planets will permit geoscientists to go places previously considered impossible for many abled and disabled individuals, further expanding the inclusiveness of the geoscience profession. GSA’s outreach efforts, including opportunities to visit informative exposures in the field, will also increase the accessibility of our exciting science to the public. GSA Meetings—annual, section, specialty/collaborative with other geo-societies, Penrose Conferences, Thompson Field Forums—will be attended in person and virtually, thereby reaching the global membership and global public. Research interest groups will flourish with the aid of virtual meetings and discussions. Language and cultural barriers will drop with the aid of translation technology.
In summary, the world is changing. The future is bright for geosciences from many perspectives, including mineral, energy, and water resources; adapting to and mitigating climate change and natural hazards; likely scientific discoveries; demographics and technologies that will attract the best and brightest; and GSA’s dimensions.
It is an honor to serve as this year’s GSA President. Thank you.
REFERENCES CITED
- Dobra, J.L., 2002, The U.S. gold industry: Nevada Bureau of Mines and Geology Special Publication 32, 40 p.
- Kreemer, C., Hammond, W.C., Blewitt, G., Holland, A.A., and Bennett, R.A., 2012, A geodetic strain rate model for the Pacific-North American plate boundary, western United States: Nevada Bureau of Mines and Geology Map 178.
- Kreemer, C., Blewitt, G., and Klein, E.C., 2014, A geodetic plate motion and global strain rate model: Geochemistry Geophysics Geosystems, v. 15, p. 3849–3889, doi: 10.1002/2014GC005407.
- Price, J.G., 2013, The challenges of mineral resources for society, in Bickford, M.E., ed., The Impact of the Geological Sciences on Society: Geological Society of America Special Paper 501, p. 1–19, doi: 10.1130/2013.2501(01).
- National Oceanic & Atmospheric Administration, 2015, Atmospheric CO2 at Mauna Loa Observatory: U.S. Department of Commerce, http://www.esrl.noaa.gov/gmd/ccgg/trends/ (last accessed 28 May 2015).
- Neuendorf, K.K.E., Mehl, J.P., Jr., and Jackson, J.A., eds., 2005, Glossary of Geology, Fifth Edition: American Geological Institute, 779 p.
- U.S. Geological Survey, 2014, Simplified 2014 hazard map (PGA, 2% in 50 years): http://earthquake.usgs.gov/hazards/products/conterminous/2014/HazardMap2014_lg.jpg (last accessed 7 Oct. 2015).
- U.S. Geological Survey, 2015, Mineral commodity summaries 2015: U.S. Geological Survey, 196 p., http://minerals.usgs.gov/minerals/pubs/mcs/2015/mcs2015.pdf (last accessed 21 Oct. 2015).
- Wilson, C., 2014, Status of the geoscience workforce: American Geosciences Institute, 125 p.