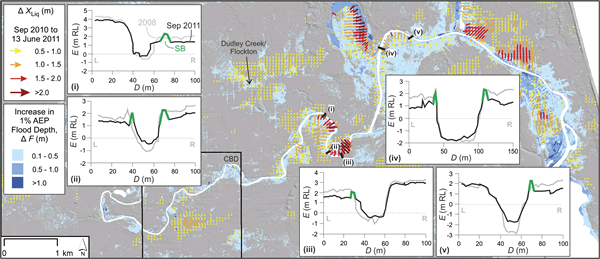
Figure 3.
Main map: Cumulative horizontal movements (ΔXLiq) in Christchurch in the vicinity of the Avon River from Sept. 2010 to 13 June 2011, derived from LiDAR offset analysis (Beavan et al., 2012a). Also shown: Increased 1-in-100-year storm event (1% Annual Exceedence Probability [AEP]) flood depths (ΔF) due to subsidence caused by the Canterbury Earthquake Sequence using current sea level, rainfall, and urban extent. The Christchurch Central Business District (CBD) is shown, as is the Dudley Creek/Flockton area where recent flooding of residential properties has been problematic. Inset panels: Floodplain and river cross sections (i–v) obtained from field survey and LiDAR analyses, with elevation (E) changes shown as relative level in meters (m RL) from 2008 (solid gray lines) to Sept. 2011 (black lines). Transect distance (D) is in meters (m). The locations of stopbanks (SB) constructed after the 22 Feb. 2011 Christchurch earthquake are shown in green.