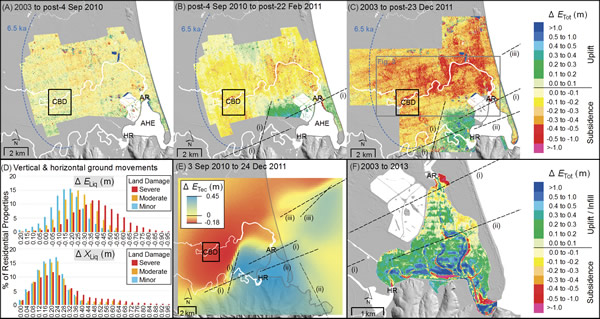
Figure 2.
(A–C) Differential LiDAR models illustrating total vertical ground movements (ΔETot) in Christchurch through the Canterbury Earthquake Sequence (CES). (A) Vertical movement from the initial 4 Sept. 2010 event. (B) Further vertical movement resulting from the 22 Feb. 2011 event. (C) Total vertical movements through the entire CES. Also shown are location of Avon River (AR) and Heathcote River (HR) mouths, the Avon-Heathcote Estuary (AHE), the Central Business District (CBD), the 6.5-ka maximum inland extent of postglacial marine transgression (blue dashed line) after Brown and Weeber (1992), and blind fault locations (black dashed lines) for 22 Feb. 2011 (i), 13 June 2011 (ii), and 23 Dec. 2011 (iii). Linear artefacts evident in (A)–(C) are due to minor elevation errors along LiDAR flight lines. (D) Histograms of LiDAR vertical ΔELiq) and horizontal (ΔXLiq) displacements classified according to observed land damage classes: ΔELiq was calculated by subtracting tectonic vertical movements (Beavan et al., 2012b) from ΔETot. (E) Cumulative tectonic vertical movements (ΔETec) through the CES, with blind fault locations shown. (F) Cumulative vertical movements through the CES for the AHE (ΔETot), with blind fault locations shown. Note that linear artefacts in (F) are due to minor elevation errors due to interpolation between ground survey and depth-sounder survey transects.