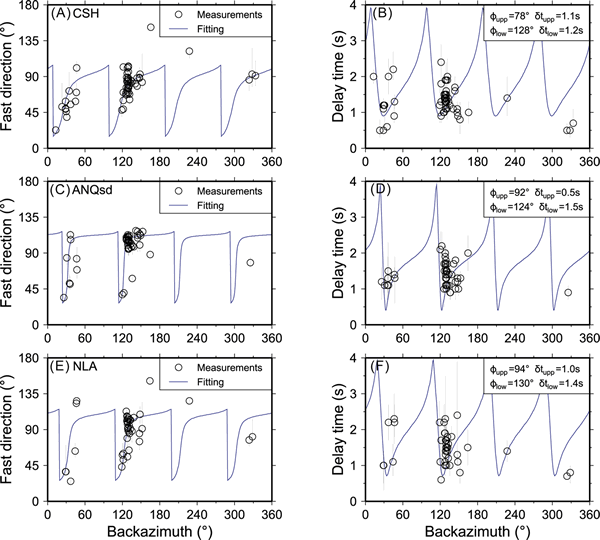
Figure 3.
Two-layer anisotropy fitting. Left and right maps show apparent variations of the observed fast direction and delay time (black circle with error bar) as a function of the back-azimuth of the incoming wave, respectively. The best fitting two layer model is shown as blue line. (A) and (B) Station CSH; (C) and (D) Station ANQsd; (E) and (F) Station NLA.