
Full Text View
Volume 25 Issue 12 (December 2015)
GSA Today
![]()
Article, pp. 4-10 | Abstract | PDF (3.5MB)
Imaging spectroscopy of geological samples and outcrops: Novel insights from microns to meters
ABSTRACT
Imaging spectroscopy is a powerful, non-destructive mineralogic tool that provides insights into a variety of geological processes. This remote measurement technique has been used for decades from orbital or aerial platforms to characterize surface compositions of Earth and other solar system bodies. These instruments have now been miniaturized for use in the laboratory and field, thereby enabling petrologic analyses of samples and outcrops. Here, we review the technique and present four examples showing the exciting science potential and new insights into geological processes.
Email:
Manuscript received 29 May 2015; accepted 27 Aug. 2015.
doi: 10.1130/GSATG252A.1
Introduction
Imaging spectroscopy is a technique whereby images are acquired in hundreds of wavelengths simultaneously, permitting spectral analysis of each discrete pixel (Goetz et al., 1985). Compositionally distinct materials reflect and absorb light differently as a function of wavelength, creating unique spectra that are used to identify and map compositional units remotely. The application of imaging spectroscopy to planetary surfaces has transformed our understanding of surface compositions throughout the solar system. The Observatoire pour la Minéralogie, l’Eau, les Glaces et l’Activité (OMEGA) and the Compact Reconnaissance Imaging Spectrometer for Mars (CRISM) have revealed the presence of clays, sulfates, carbonates, and other minerals formed through interaction with water on Mars, illuminating potentially habitable past environments (e.g., Bibring et al., 2006; Mustard et al., 2008; Murchie et al., 2009). The Moon Mineralogy Mapper (M3) provided new insights into the formation, igneous evolution, and composition of the Moon and discovered small and varying amounts of hydroxylated or water-bearing materials in its regolith (Green et al., 2011; Pieters et al., 2009, 2011). The Near Infrared Mapping Spectrometer (NIMS) on the Galileo spacecraft (Carlson et al., 1992) detected hydrated salts on Europa (McCord et al., 1998) and mapped SO2 volcanism on Io (Douté et al., 2001). The Visible and Infrared (VIR) Mapping Spectrometer mapped lithologic units on Vesta’s surface (de Sanctis et al., 2012a, 2012b) and has arrived at the dwarf planet Ceres. The Visual and Infrared Mapping Spectrometer (VIMS) on the Cassini spacecraft mapped surface compositions on satellites of Saturn and discovered a large ethane cloud on Titan (Brown et al., 2006; Griffith et al., 2006). Closer to home, imaging spectrometers flown on aircraft, such as the Airborne Visible/Infrared Imaging Spectrometer (AVIRIS) and HyMap, and in space, such as Hyperion, have mapped mineralogies and monitored dynamic changes in ice, vegetation, and other surface processes on Earth (e.g., Vane et al., 1993; Cocks et al., 1998; Green et al., 1998; Painter et al., 2003; Pearlman et al., 2003; Asner et al., 2004, 2007).
For geological applications, at the typical tens to hundreds of meters spatial resolutions of these imaging spectrometers (Fig. 1), regional or global lithologic units can be distinguished, and some components of the mineral assemblages can be identified. The highest-resolution airborne imaging spectrometers currently achieve spatial resolutions of meters, permitting discrimination of mineralogies at scales of boulders or larger outcrops. However, spatial resolutions of a centimeter or less are generally necessary to investigate the mineralogic and petrologic relationships within rocks—essential to understanding the geologic history—and airborne and orbital imaging spectrometers cannot achieve these resolutions. The next revolution is field- and laboratory-based imaging spectroscopy at sub-millimeter to centimeter resolutions capable of petrologic analyses (e.g., Fig. 1).
|
Conceptual plot of the relative spectral sampling versus the spatial scales of observations by various imaging systems and the gap that ground-based imaging spectroscopy fills (dashed box). Blue text indicates imaging systems on Earth, red italicized text is for Mars, and gray bolded text is for the Moon. The number of spectral bands and the spatial resolutions used in this plot are generally those in the visible-shortwave infrared regions. The Headwall and Ultra Compact Imaging Spectrometer (UCIS) imagers were used to acquire data presented in this paper. ASTER—Advanced Spaceborne Thermal Emission and Reflection Radiometer; AVIRIS—Airborne Visible/Infrared Imaging Spectrometer; CAO-AToMS—Carnegie Airborne Observatory–Airborne Taxonomic Mapping System; CRISM—Compact Reconnaissance Imaging Spectrometer for Mars; M3—Moon Mineralogy Mapper; OMEGA—Observatoire pour la Minéralogie, l’Eau, les Glaces et l’Activité; HiRISE—High Resolution Imaging Spectrometer Experiment; MODIS—Moderate Resolution Imaging Spectrometer; THEMIS VIS/IR—Thermal Emission Imaging System (visible/infrared). |
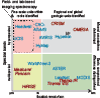 Figure 1
Recently, visible-shortwave infrared (VSWIR) imaging spectrometers have been miniaturized and are now commercially available for use in the field and laboratory (e.g., manufactured by Headwall Photonics, Inc., Norskk Elektro Optikk AS, and SPECIM), and prototypes have been deployed and demonstrated for use on planetary missions (Blaney et al., 2014; Ehlmann et al., 2014; Van Gorp et al., 2014; Pilorget and Bibring, 2013). Specifically, the Ultra Compact Imaging Spectrometer (UCIS) is in development by the Jet Propulsion Laboratory for a future mission (Van Gorp et al., 2014), and the MicrOmega instrument will be on the upcoming ExoMars rover and Hayabusa-2 mission (Pilorget and Bibring, 2013). An orbital VSWIR imaging spectrometer has also been selected to fly to Europa. The shortwave infrared wavelengths are critical for mineralogic analyses because unique overtones and combination tones of vibrations within mineral structures occur in this region. The visible wavelengths alone cannot distinguish mineralogies. While not the focus of this paper, similar systems are in development to measure thermal infrared emissivity in the laboratory (e.g., Edwards and Christensen, 2013). There is a steadily growing suite of literature on the use of imaging spectroscopy of outcrops and samples, including core scanning, to answer geologically relevant questions (e.g., Kruse et al., 2012; Kurz et al., 2012; Murphy et al., 2012, 2014; Butz et al., 2015; Greenberger et al., 2015a, 2015b; Yokoyama et al., 2015). Here we highlight some exciting applications of this emerging, non-destructive technology and the science discoveries enabled.
Example 1: Characterizing Habitability and Searching for Biosignatures in Serpentine-Bearing Rock
The serpentinization process liberates molecular hydrogen that can sustain microbial communities and react through biotic and abiotic processes to form methane (e.g., Kelley et al., 2001, 2005; Sleep et al., 2004; Oze and Sharma, 2005; Schulte et al., 2006; Cardace and Hoehler, 2009; Etiope and Sherwood Lollar, 2013; McCollom and Seewald, 2013). The oxidation states and coordination environments of iron produce diagnostic absorption features readily detected and mapped with imaging spectroscopy but not so easily spatially resolved with traditional analysis techniques. In serpentinized bodies, the oxidation state and iron coordination chemistry are related to the volume of hydrogen produced and the availability of reduced gasses capable of supporting microbial metabolisms (Marcaillou et al., 2011; Andreani et al., 2013). Though degrees of serpentinization are not readily apparent visually, work by Greenberger et al. (2015b) used imaging spectroscopy in the 0.42–1.1 µm region to map the depth of an electronic transition of tetrahedrally coordinated Fe3+ occurring at 0.45 µm as a proxy for hydrogen production. Using new imaging data that cover an extended wavelength range (0.40–2.5 µm; Fig. 2), the 0.45 µm feature is shown with the two dominant minerals, carbonate and serpentine, which exhibit sharp vibrational absorptions mapped through calculation of the depths of these features (Clark and Roush, 1984) and other spectral parameters (data processing algorithms are described in the GSA Supplemental Data Repository 1 ). Different portions of this sample have undergone different degrees of serpentinization; those areas with tetrahedral Fe3+ have undergone advanced serpentinization and are promising areas to search with still higher spatial resolution compositional or isotopic techniques (e.g., scanning electron microscopy, mass spectrometry) for microbial biosignatures and to understand the production of reduced gases.
1 GSA supplemental data item 2015342, imaging spectroscopy methods and calibration, is online at www.geosociety.org/pubs/ft2015.htm. You can also request a copy from GSA Today, P.O. Box 9140, Boulder, CO 80301-9140, USA; .
|
Hyperspectral image of a serpentinite sample with red and green coatings (Nor4-14, described in Greenberger et al., 2015b) from Norbestos, Quebec, Canada. (A) Photograph of the full rock. (B) Image showing spectral parameters that map calcite (red), serpentine (green), and a feature at 0.45 µm (BD450; blue) due to tetrahedral Fe3+ within serpentine. The third dimension shows the reflectance as a function of wavelength for each pixel within the image, with black and purple being low and red high. (C) Plot with representative spectra of different units within the hyperspectral image. Colors correspond to colors in the spectral parameter image with locations numbered. Close-up views of the 0.45 µm feature are shown on the right. These images were acquired with Headwall Photonics Inc. High Efficiency Hyperspec® visible–near-infrared E-series (0.4–1.0 µm, 7 nm spectral resolution, 0.382 mrad instantaneous field of view) and High Efficiency Hyperspec® shortwave infrared X-series pushbroom systems (1.0–2.5 µm, 12 nm spectral resolution, 1.2 mrad instantaneous field of view) imaging spectrometers (see GSA Supplemental Data Repository [see footnote 1] for more information). |
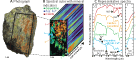 Figure 2
Example 2: Hydrothermal Alteration and Diagenesis of Lacustrine Pillow Basalts
Alteration rinds illuminate conditions of water-rock interactions, and progressive changes from interior to exterior reflect increasing degrees of alteration (e.g., Hausrath et al., 2008). With sub-millimeter spatial resolutions, imaging spectroscopy measurements of alteration rinds resolve fine changes in mineralogy with alteration. Data from an Early Jurassic lacustrine pillow lava from the Hartford Basin are shown in Figure 3 (Greenberger et al., 2015a). In this work, coordinated imaging spectroscopy, electron microprobe, microscopic X-ray diffraction, microscopic thermal emission spectroscopy, and microscopic Raman spectroscopy analyses of a thick section across an alteration rind (Fig. 3C) characterized spectral, mineralogic, and chemical transformations. Unexpected key identifications with imaging spectroscopy include calcic clinopyroxenes interpreted to have formed through >400 °C hydrothermal alteration (e.g., Bird et al., 1984; Manning and Bird, 1986), pervasive oxidation, Fe/Mg-phyllosilicate signatures that increase in strength toward the exterior, and higher water content of calcites in the rind, either as structural H2O or fluid inclusions (Greenberger et al., 2015a). In addition, <2 mm-sized areas of datolite [CaBSiO4(OH)] formed from boron-rich hydrothermal fluids. While datolite is apparent elsewhere in this outcrop and has been reported throughout the Hartford Basin, the areas of datolite mineralization in this sample were unexpected because they are too small to be distinguished visually from the abundant calcite. However, they are spectrally distinct in the ~133 µm/pixel VSWIR imaging data. Imaging spectroscopy correlates and scales all of these results to the hand-sample (full cross section of the pillow lava; Figs. 3A–3B) and to portions of the outcrop characterized by similar green alteration rinds, and the same spectral features are observed at all scales. These results are consistent with a scenario in which the pillow lavas were altered initially after emplacement at high temperatures, overprinted by a progressively cooling hydrothermal system, and then altered after burial through diagenesis, specifically albitization followed by calcite precipitation (Greenberger et al., 2015a, and references therein).
|
(A) Color composite image from a hyperspectral image acquired with the same imaging system used in Figure 2, approximating the true color of a pillow lava cross section. (B) Mineral indicator map showing calcite in red, a spectral slope indicative of the rind in green, and Fe/Mg-clay in blue. The cyan box shows the approximate location of the material on the adjacent cut face from which a thick section was prepared and imaged. (C) Mineral indicator and spectral parameter image of the thick section using the same parameters as (B). The dashed white outline shows the location of identified datolite. (D) Plot with spectral transect from the interior through the alteration rind (purple to green; location of transect shown in A). The spectrum of the innermost point (purple) reflects the oxidized, anhydrous nature of the interior matrix. Spectra of the rind (green) are consistent with an Fe/Mg-clay (chlorite and/or nontronite) and calcic clinopyroxenes. Guidelines show absorption features due to various molecular vibrations or other key spectral characteristics. A scaled, three-point moving average spectrum of datolite (black) acquired within the thick section is also shown. This figure is modified from data presented in Greenberger et al. (2015a). |
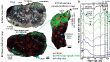 Figure 3
Example 3: Meteorites, Mapping of Precious Materials Non-Destructively
Analysis of geological samples typically requires preparation of thin sections or powders for determination of crystal structure and chemical composition. Simultaneous analysis of small-scale mineralogy and texture with VSWIR microimaging spectroscopy requires no sample preparation and can be performed on a rough or cut surface. This approach is ideal for the survey of a collection of rare or precious samples to best target locations for follow-up destructive or high spatial resolution analyses. It is also ideal for in situ exploration of planetary surfaces when conducting multi-step sample preparation procedures may be prohibitively complex. Analyses of the CM2 carbonaceous chondrite Murchison from the Arizona State University meteorite collection were conducted with UCIS in micro-imaging mode (~80 µm/pixel; Fig. 4) (Ehlmann et al., 2014; Van Gorp et al., 2014; Green et al., 2015). Olivine-rich chondrules (green areas, Fig. 4B) of varying sizes are observed throughout the sample, and UCIS data permit ready identification of an atypical area, no more than a few pixels in size, with a low-calcium pyroxene-rich clast, most likely a chondrule fragment (magenta, Figs. 4D and 4F). Chondrules where olivine is affected by aqueous alteration (dark green spectrum) versus those unaffected (light green) can be discriminated (Fig. 4E), and several Fe/Mg phyllosilicate alteration phases are mapped in the matrix (blue areas in Fig. 4B; blue spectra in Fig. 4G). In addition, comparisons of the near true color image with infrared mapping in Figures 4A–4B show that visually similar areas are compositionally quite variable. VSWIR microimages acquired in minutes quickly map distributions of mafic and altered phases while highlighting key compositional variations, allowing investigators to zero-in on sample locations of highest interest for more accurate but time-consuming instrumental techniques such as electron microprobe, transmission electron microscopy, or NanoSIMS analyses.
|
Image of the Murchison meteorite acquired with UCIS. (A) Near true color composite image of a cut face of the meteorite using hyperspectral data. (B) Mineral indicator map in which low-calcium pyroxene appears magenta, olivine is green, and water-bearing materials are blue. Close-up of two interesting regions of the meteorite with a (C) zone of altered olivine and (D) fragment of low-calcium pyroxene. Spectra from the USGS spectral library are shown in black and gold in (E)–(G) for comparison with meteorite spectra (Clark et al., 2007). (E) Spectra of olivine-bearing spots with (dark green) and without (light green) spectral features indicative of hydration. (F) Spectrum of low-Ca pyroxene (shown in D), likely from a chondrule fragment. (G) Matrix materials within the chondritic sample are clearly water-bearing but are distinctive in composition from typical terrestrial chlorites and serpentines. The light blue spectrum is from (C). |
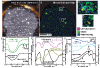 Figure 4
Example 4: Mapping of Sedimentary Rocks Exposed at Mills Creek
We imaged an outcrop of sedimentary rocks exposed along Mills Creek near Mono Lake, California, with UCIS in field mapping mode (Fig. 5; 0.5–2.5 µm; instantaneous field of view 1.35 mrad, 12 nm spectral resolution). Using spectral parameters, we mapped specific mineral phases present at the site, including hydrated silica (opal A), clays (Fe-, Mg-, and Al-bearing), calcite, illite/muscovite, and epidote (Fig. 5B). From these results, the stratigraphy of the outcrop lithologies can be inferred (Fig. 5C), showing variations in the depths of absorption features related to hydrated silica (red or orange) and clay mineral (green) contents of the sedimentary layers. The float rocks above the outcrop and along the creek bed at the bottom of the image have diverse compositions. Based on the higher proportions of rocks with significant calcite (cyan) and illite (magenta), we infer the likely presence of calcite- and illite-rich units higher in the stratigraphy that are not exposed at this outcrop. Much of this calcite- and illite-rich talus is located on the left portion of the outcrop near a small fan and likely is sourced from above the layered section, whereas the float rocks to the right are more similar compositionally to the exposed layered outcrop.
|
(A) Color composite image approximating true color of an outcrop along Mills Creek imaged with UCIS. (B) Spectral parameter map. Red is the band depth of a spectral feature at 2.21 µm (BD2210) due to Si-OH and/or Al-OH combination absorptions. Green is the band depth of a feature at 2.31–2.32 µm (BD2310-20) likely due to Mg-OH combinations. Blue is the band depth of a feature at 2.34–2.35 µm (BD2340-50) due to either a C-O combination in calcite or Fe-OH combinations in a mineral such as chlorite or epidote (Clark et al., 1990). (C) Schematic lithostratigraphic section from area outlined in yellow boxes in (A) and (B) with colors corresponding to the colors in (B). Dark green layers have weak Fe/Mg/Al clay features. Other colors correspond with minerals names under the stratigraphic section. (D) Example spectra of different units with colors corresponding to (B) and (C). Locations of each spectrum are numbered on both images. Dashed lines are, from left to right, at 2.21, 2.31, and 2.34 µm, corresponding with the positions of spectral features mapped in (B). Spectral regions with terrestrial atmosphere are removed and covered with light gray boxes. |
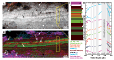 Figure 5
Conclusions
Imaging spectroscopy of samples and outcrops enables new science investigations and yields novel or unexpected mineralogic and petrologic insights into a variety of geological processes (Greenberger, 2015). This technique rapidly and non-destructively maps mineralogies with little sample preparation, showing mineral associations that might not otherwise be apparent and guiding further investigations using other, more time-consuming techniques. Other investigations have used imaging spectroscopy at similar scales to find economically viable deposits of minerals (Kruse et al., 2012), map carbonate lithologies (Baissa et al., 2011; Kurz et al., 2012), characterize alteration of basaltic samples from an impact structure (Yokoyama et al., 2015) and in a cold and arid environment (Cannon et al., 2015b), quantify the abundances of iron in a mine wall (Murphy and Monteiro, 2013), map clay layers (Murphy et al., 2014), and study the Black Beauty meteorite from Mars (Cannon et al., 2015a). These types of studies also aid in preparing for imaging spectrometers on future landed planetary missions. Imaging spectrometers used herein are currently employed in laboratories such as at Brown University, the California Institute of Technology, and the University of Winnipeg.
Acknowledgments
We would like to thank Headwall Photonics, Inc., especially David Bannon and Kwok Wong, for use of their hyperspectral imagers to acquire the images used in examples 1 and 2. We also thank the JPL team (Byron Van Gorp, Zakos Mouroulis, Jose Rodriguez, Mark Helmlinger, and Morgan Cable) for assistance in acquiring UCIS data in examples 3 and 4. Thanks to Mini Wadhwa (Arizona State University) for loan of the Murchison sample. Finally, we would like to thank Jerry Dickens for editorial handling and Adrian Brown and Fred Kruse for helpful reviews. Portions of this research were carried out at the Jet Propulsion Laboratory, California Institute of Technology, under a contract with the National Aeronautics and Space Administration.
REFERENCES CITED
- Andreani, M., Muñoz, M., Marcaillou, C., and Delacour, A., 2013, µXANES study of iron redox state in serpentine during oceanic serpentinization: Lithos, v. 178, p. 70–83, doi: 10.1016/j.lithos.2013.04.008.
- Asner, G.P., Nepstad, D., Cardinot, G., and Ray, D., 2004, Drought stress and carbon uptake in an Amazon forest measured with spaceborne imaging spectroscopy: PNAS, v. 101, p. 6039–6044, doi: 10.1073/pnas.0400168101.
- Asner, G.P., Knapp, D.E., Kennedy-Bowdoin, T., Jones, M.O., Martin, R.E., Boardman, J., and Field, C.B., 2007, Carnegie Airborne Observatory: In-flight fusion of hyperspectral imaging and waveform light detection and ranging for three-dimensional studies of ecosystems: Journal of Applied Remote Sensing, v. 1, 013536, doi: 10.1117/1.2794018.
- Baissa, R., Labbassi, K., Launeau, P., Gaudin, A., and Ouajhain, B., 2011, Using HySpex SWIR-320m hyperspectral data for the identification and mapping of minerals in hand specimens of carbonate rocks from the Ankloute Formation (Agadir Basin, Western Morocco): Journal of African Earth Sciences, v. 61, p. 1–9, doi: 10.1016/j.jafrearsci.2011.04.003.
- Bibring, J.-P., Langevin, Y., Mustard, J.F., Poulet, F., Arvidson, R., Gendrin, A., Gondet, B., Mangold, N., Pinet, P., Forget, F., and the OMEGA team, 2006, Global Mineralogical and Aqueous Mars History Derived from OMEGA/Mars Express Data: Science, v. 312, p. 400–404, doi: 10.1126/science.1122659.
- Bird, D.K., Schiffman, P., Elders, W.A., Williams, A.E., and McDowell, S.D., 1984, Calc-silicate mineralization in active geothermal systems: Economic Geology and the Bulletin of the Society of Economic Geologists, v. 79, p. 671–695, doi: 10.2113/gsecongeo.79.4.671.
- Blaney, D.L., Murchie, S.L., Green, R.O., Mustard, J., Ehlmann, B., Mouroulis, P., Van Gorp, B., Rodriguez, J., Seelos, F., and Ehlmann, B.L., 2014, Ultra Compact Imaging Spectrometer (UCIS): Technology Maturation and Applications for Mars, the Moon, and Small Bodies: International Workshop on Instrumentation for Planetary Missions, 4–7 November 2014, Greenbelt, Maryland, abs.1148.
- Brown, R.H., Clark, R.N., Buratti, B.J., Cruikshank, D.P., Barnes, J.W., Mastrapa, R.M.E., Bauer, J., Newman, S., Momary, T., Baines, K.H., Bellucci, G., Capaccioni, F., Cerroni, P., Combes, M., et al., 2006, Composition and Physical Properties of Enceladus’ Surface: Science, v. 311, p. 1425–1428, doi: 10.1126/science.1121031.
- Butz, C., Grosjean, M., Fischer, D., Wunderle, S., Tylmann, W., and Rein, B., 2015, Hyperspectral imaging spectroscopy: A promising method for the biogeochemical analysis of lake sediments: Journal of Applied Remote Sensing, v. 9, 096031, doi: 10.1117/1.JRS.9.096031.
- Cannon, K.M., Mustard, J.F., and Agee, C.B., 2015a, Evidence for a widespread basaltic breccia component in the martian low-albedo regions from the reflectance spectrum of Northwest Africa 7034: Icarus, v. 252, p. 150–153, doi: 10.1016/j.icarus.2015.01.016.
- Cannon, K.M., Mustard, J.F., and Salvatore, M.R., 2015b, Alteration of immature sedimentary rocks on Earth and Mars: Recording aqueous and surface-atmosphere processes: Earth and Planetary Science Letters, v. 417, p. 78–86, doi: 10.1016/j.epsl.2015.02.017.
- Cardace, D., and Hoehler, T.M., 2009, Serpentinizing fluids craft microbial habitat: Northeastern Naturalist, v. 16, p. 272–284, doi: 10.1656/045.016.0520.
- Carlson, R.W., Weissman, P.R., Smythe, W.D., Mahoney, J.C., and the NIMS Science and Engineering Teams, 1992, Near-infrared mapping spectrometer experiment on Galileo: Space Science Reviews, v. 60, p. 457–502, doi: 10.1007/BF00216865.
- Clark, R.N., and Roush, T.L., 1984, Reflectance spectroscopy: Quantitative analysis techniques for remote sensing applications: Journal of Geophysical Research, Solid Earth, v. 89, p. 6329–6340, doi: 10.1029/JB089iB07p06329.
- Clark, R.N., King, T.V.V., Klejwa, M., Swayze, G.A., and Vergo, N., 1990, High Spectral Resolution Reflectance Spectroscopy of Minerals: Journal of Geophysical Research, v. 95, p. 12,653–12,680, doi: 10.1029/JB095iB08p12653.
- Clark, R.N., Swayze, G.A., Wise, R., Livo, E., Hoefen, T., Kokaly, R., and Sutley, S.J., 2007, USGS Digital Spectral Library 06: U.S. Geological Survey, Digital Data Series 231, http://speclab.cr.usgs.gov/spectral.lib06/ (last accessed 24 Sept. 2015).
- Cocks, T., Jenssen, R., Stewart, A., Wilson, I., and Shields, T., 1998, The HyMapTM airborne hyperspectral sensor: The system, calibration and performance, in Proceedings of the 1st EARSeL workshop on Imaging Spectroscopy, Zurich, p. 37–42.
- de Sanctis, M.C., Ammannito, E., Capria, M.T., Tosi, F., Capaccioni, F., Zambon, F., Carraro, F., Fonte, S., Frigeri, A., Jaumann, R., Magni, G., Marchi, S., McCord, T.B., McFadden, L.A., et al., 2012a, Spectroscopic Characterization of Mineralogy and Its Diversity Across Vesta: Science, v. 336, p. 697–700, doi: 10.1126/science.1219270.
- de Sanctis, M.C., Combe, J.-P., Ammannito, E., Palomba, E., Longobardo, A., McCord, T.B., Marchi, S., Capaccioni, F., Capria, M.T., Mittlefehldt, D.W., Pieters, C.M., Sunshine, J., Tosi, F., Zambon, F., et al., 2012b, Detection of Widespread Hydrated Materials on Vesta by the VIR Imaging Spectrometer on board the Dawn Mission: The Astrophysical Journal Letters, v. 758, L36, doi: 10.1088/2041-8205/758/2/L36.
- Douté, S., Schmitt, B., Lopes-Gautier, R., Carlson, R., Soderblom, L., Shirley, J., and the Galileo NIMS Team, 2001, Mapping SO2 Frost on Io by the Modeling of NIMS Hyperspectral Images: Icarus, v. 149, p. 107–132, doi: 10.1006/icar.2000.6513.
- Edwards, C.S., and Christensen, P.R., 2013, Microscopic emission and reflectance thermal infrared spectroscopy: Instrumentation for quantitative in situ mineralogy of complex planetary surfaces: Applied Optics, v. 52, 2200, doi: 10.1364/AO.52.002200.
- Ehlmann, B.L., Mouroulis, P., Van Gorp, B., Green, R., Blaney, D., Rodriguez, J., Mustard, J., Murchie, S., Herd, C., Seelos, F., and Feldman, S., 2014, Microimaging VSWIR Spectroscopy Instruments for Planetary Exploration: Measuring In-Situ Mineralogy, Ices, Organics, and Linking to Remote Observation: International Workshop on Instrumentation for Planetary Missions, 4–7 November 2014, Greenbelt, Maryland, abs. 1046.
- Etiope, G., and Sherwood Lollar, B., 2013, Abiotic Methane on Earth: Reviews of Geophysics, v. 51, p. 276–299, doi: 10.1002/rog.20011.
- Goetz, A.F.H., Vane, G., Solomon, J.E., and Rock, B.N., 1985, Imaging Spectrometry for Earth Remote Sensing: Science, v. 228, p. 1147–1153, doi: 10.1126/science.228.4704.1147.
- Green, R.O., Eastwood, M.L., Sarture, C.M., Chrien, T.G., Aronsson, M., Chippendale, B.J., Faust, J.A., Pavri, B.E., Chovit, C.J., Solis, M., Olah, M.R., and Williams, O., 1998, Imaging Spectroscopy and the Airborne Visible/Infrared Imaging Spectrometer (AVIRIS): Remote Sensing of Environment, v. 65, p. 227–248, doi: 10.1016/S0034-4257(98)00064-9.
- Green, R.O., Pieters, C., Mouroulis, P., Eastwood, M., Boardman, J., Glavich, T., Isaacson, P., Annadurai, M., Besse, S., Barr, D., Buratti, B., Cate, D., Chatterjee, A., Clark, R., et al., 2011, The Moon Mineralogy Mapper (M3) imaging spectrometer for lunar science: Instrument description, calibration, on-orbit measurements, science data calibration and on-orbit validation: Journal of Geophysical Research, Planets, v. 116, E00G19, doi: 10.1029/2011JE003797.
- Green, R.O., Ehlmann, B.L., Fraeman, A.A., Blaney, D., Liu, Y., Chabot, N.L., Murchie, S., Wadhwa, M., Herd, C.D.K., Velbel, M.A., Mouroulis, P., and Van Gorp, B., 2015, Microimaging Spectroscopy for the Exploration of Small Bodies: First Laboratory Measurements of Carbonaceous Chondrite and HED Meteorites and a Proposed M6 Instrument for In Situ Measurement: Lunar and Planetary Science Conference, abs. 2154.
- Greenberger, R.N., 2015, High Temperature Aqueous Alteration and Diagenesis: Unexpected Insights with Imaging Spectroscopy from Microns to Meters [Ph.D. Thesis]: Brown University, 331 p.
- Greenberger, R.N., Mustard, J.F., Cloutis, E.A., Mann, P., Wilson, J.H., Flemming, R.L., Robertson, K.M., Salvatore, M.R., and Edwards, C.S., 2015a, Hydrothermal alteration and diagenesis of terrestrial lacustrine pillow basalts: Coordination of hyperspectral imaging with laboratory measurements: Geochimica et Cosmochimica Acta, v. 171, p. 174–200, doi: 10.1016/j.gca.2015.08.024.
- Greenberger, R.N., Mustard, J.F., Cloutis, E.A., Pratt, L.M., Sauer, P.E., Mann, P., Turner, K., Dyar, M.D., and Bish, D.L., 2015b, Serpentinization, iron oxidation, and aqueous conditions in an ophiolite: Implications for hydrogen production and habitability on Mars: Earth and Planetary Science Letters, v. 416, p. 21–34, doi: 10.1016/j.epsl.2015.02.002.
- Griffith, C.A., Penteado, P., Rannou, P., Brown, R., Boudon, V., Baines, K.H., Clark, R., Drossart, P., Buratti, B., Nicholson, P., McKay, C.P., Coustenis, A., Negrao, A., and Jaumann, R., 2006, Evidence for a Polar Ethane Cloud on Titan: Science, v. 313, p. 1620–1622, doi: 10.1126/science.1128245.
- Hausrath, E.M., Navarre-Sitchler, A.K., Sak, P.B., Steefel, C.I., and Brantley, S.L., 2008, Basalt weathering rates on Earth and the duration of liquid water on the plains of Gusev Crater, Mars: Geology, v. 36, p. 67–70, doi: 10.1130/G24238A.1.
- Kelley, D.S., Karson, J.A., Blackman, D.K., Früh-Green, G.L., Butterfield, D.A., Lilley, M.D., Olson, E.J., Schrenk, M.O., Roe, K.K., Lebon, G.T., Rivizzigno, P., and the AT3-60 Shipboard Party, 2001, An off-axis hydrothermal vent field near the Mid-Atlantic Ridge at 30° N: Nature, v. 412, p. 145–149, doi: 10.1038/35084000.
- Kelley, D.S., Karson, J.A., Früh-Green, G.L., Yoerger, D.R., Shank, T.M., Butterfield, D.A., Hayes, J.M., Schrenk, M.O., Olson, E.J., Proskurowski, G., Jakuba, M., Bradley, A., Larson, B., Ludwig, K., et al., 2005, A serpentinite-hosted ecosystem: The Lost City hydrothermal field: Science, v. 307, p. 1428–1434, doi: 10.1126/science.1102556.
- Kruse, F.A., Bedell, R.L., Taranik, J.V., Peppin, W.A., Weatherbee, O., and Calvin, W.M., 2012, Mapping alteration minerals at prospect, outcrop and drill core scales using imaging spectrometry: International Journal of Remote Sensing, v. 33, p. 1780–1798, doi: 10.1080/01431161.2011.600350.
- Kurz, T.H., Dewit, J., Buckley, S.J., Thurmond, J.B., Hunt, D.W., and Swennen, R., 2012, Hyperspectral image analysis of different carbonate lithologies (limestone, karst and hydrothermal dolomites): the Pozalagua Quarry case study (Cantabria, North-west Spain): Sedimentology, v. 59, p. 623–645, doi: 10.1111/j.1365-3091.2011.01269.x.
- Manning, C.E., and Bird, D.K., 1986, Hydrothermal clinopyroxenes of the Skaergaard intrusion: Contributions to Mineralogy and Petrology, v. 92, p. 437–447, doi: 10.1007/BF00374426.
- Marcaillou, C., Muñoz, M., Vidal, O., Parra, T., and Harfouche, M., 2011, Mineralogical evidence for H2 degassing during serpentinization at 300 °C/300 bar: Earth and Planetary Science Letters, v. 303, p. 281–290, doi: 10.1016/j.epsl.2011.01.006.
- McCollom, T.M., and Seewald, J.S., 2013, Serpentinites, Hydrogen, and Life: Elements, v. 9, p. 129–134, doi: 10.2113/gselements.9.2.129.
- McCord, T.B., Hansen, G.B., Fanale, F.P., Carlson, R.W., Matson, D.L., Johnson, T.V., Smythe, W.D., Crowley, J.K., Martin, P.D., Ocampo, A., Hibbitts, C.A., and Granahan, J.C., and the NIMS Team, 1998, Salts on Europa’s surface detected by Galileo’s near infrared mapping spectrometer: Science, v. 280, p. 1242–1245, doi: 10.1126/science.280.5367.1242.
- Murchie, S.L., Mustard, J.F., Ehlmann, B.L., Milliken, R.E., Bishop, J.L., McKeown, N.K., Noe Dobrea, E.Z., Seelos, F.P., Buczkowski, D.L., Wiseman, S.M., Arvidson, R.E., Wray, J.J., Swayze, G., Clark, R.N., et al., 2009, A synthesis of Martian aqueous mineralogy after 1 Mars year of observations from the Mars Reconnaissance Orbiter: Journal of Geophysical Research, v. 114, E2, doi: 10.1029/2009JE003342.
- Murphy, R.J., and Monteiro, S.T., 2013, Mapping the distribution of ferric iron minerals on a vertical mine face using derivative analysis of hyperspectral imagery (430–970 nm): ISPRS Journal of Photogrammetry and Remote Sensing, v. 75, p. 29–39, doi: 10.1016/j.isprsjprs.2012.09.014.
- Murphy, R.J., Monteiro, S.T., and Schneider, S., 2012, Evaluating Classification Techniques for Mapping Vertical Geology Using Field-Based Hyperspectral Sensors: IEEE Transactions on Geoscience and Remote Sensing, v. 50, p. 3066–3080, doi: 10.1109/TGRS.2011.2178419.
- Murphy, R.J., Schneider, S., and Monteiro, S.T., 2014, Mapping Layers of Clay in a Vertical Geological Surface Using Hyperspectral Imagery: Variability in Parameters of SWIR Absorption Features under Different Conditions of Illumination: Remote Sensing, v. 6, p. 9104–9129, doi: 10.3390/rs6099104.
- Mustard, J.F., Murchie, S.L., Pelkey, S.M., Ehlmann, B.L., Milliken, R.E., Grant, J.A., Bibring, J.-P., Poulet, F., Bishop, J., Noe Dobrea, E.Z., Roach, L., Seelos, F., Arvidson, R.E., Wiseman, S., et al., 2008, Hydrated silicate minerals on Mars observed by the Mars Reconnaissance Orbiter CRISM instrument: Nature, v. 454, p. 305–309, doi: 10.1038/nature07097.
- Oze, C., and Sharma, M., 2005, Have olivine, will gas: Serpentinization and the abiogenic production of methane on Mars: Geophysical Research Letters, v. 32, doi: 10.1029/2005GL022691.
- Painter, T.H., Dozier, J., Roberts, D.A., Davis, R.E., and Green, R.O., 2003, Retrieval of subpixel snow-covered area and grain size from imaging spectrometer data: Remote Sensing of Environment, v. 85, p. 64–77, doi: 10.1016/S0034-4257(02)00187-6.
- Pearlman, J.S., Barry, P.S., Segal, C.C., Shepanski, J., Beiso, D., and Carman, S.L., 2003, Hyperion, a space-based imaging spectrometer: IEEE Transactions on Geoscience and Remote Sensing, v. 41, p. 1160–1173, doi: 10.1109/TGRS.2003.815018.
- Pieters, C.M., Goswami, J.N., Clark, R.N., Annadurai, M., Boardman, J., Buratti, B., Combe, J.-P., Dyar, M.D., Green, R., Head, J.W., Hibbitts, C., Hicks, M., Isaacson, P., Klima, R., et al., 2009, Character and spatial distribution of OH/H2O on the surface of the Moon seen by M3 on Chandrayaan-1: Science, v. 326, p. 568–572, doi: 10.1126/science.1178658.
- Pieters, C.M., Besse, S., Boardman, J., Buratti, B., Cheek, L., Clark, R.N., Combe, J.P., Dhingra, D., Goswami, J.N., Green, R.O., Head, J.W., Isaacson, P., Klima, R., Kramer, G., et al., 2011, Mg-spinel lithology: A new rock type on the lunar farside: Journal of Geophysical Research. Planets, v. 116, E00G08, doi: 10.1029/2010JE003727.
- Pilorget, C., and Bibring, J.-P., 2013, NIR reflectance hyperspectral microscopy for planetary science: Application to the MicrOmega instrument: Planetary and Space Science, v. 76, p. 42–52, doi: 10.1016/j.pss.2012.11.004.
- Schulte, M., Blake, D., Hoehler, T., and McCollom, T., 2006, Serpentinization and its implications for life on the early Earth and Mars: Astrobiology, v. 6, p. 364–376, doi: 10.1089/ast.2006.6.364.
- Sleep, N.H., Meibom, A., Fridriksson, T., Coleman, R.G., and Bird, D.K., 2004, H2-rich fluids from serpentinization: Geochemical and biotic implications: PNAS, v. 101, p. 12,818–12,823, doi: 10.1073/pnas.0405289101.
- Vane, G., Green, R.O., Chrien, T.G., Enmark, H.T., Hansen, E.G., and Porter, W.M., 1993, The airborne visible/infrared imaging spectrometer (AVIRIS): Remote Sensing of Environment, v. 44, p. 127–143, doi: 10.1016/0034-4257(93)90012-M.
- Van Gorp, B., Mouroulis, P., Blaney, D., Green, R.O., Ehlmann, B.L., and Rodriguez, J.I., 2014, Ultra-compact imaging spectrometer for remote, in situ, and microscopic planetary mineralogy: Journal of Applied Remote Sensing, v. 8, 084988, doi: 10.1117/1.JRS.8.084988.
- Yokoyama, E., Nédélec, A., Baratoux, D., Trindade, R.I.F., Fabre, S., and Berger, G., 2015, Hydrothermal alteration in basalts from Vargeão impact structure, south Brazil, and implications for recognition of impact-induced hydrothermalism on Mars: Icarus, v. 252, p. 347–365, doi: 10.1016/j.icarus.2015.02.001.