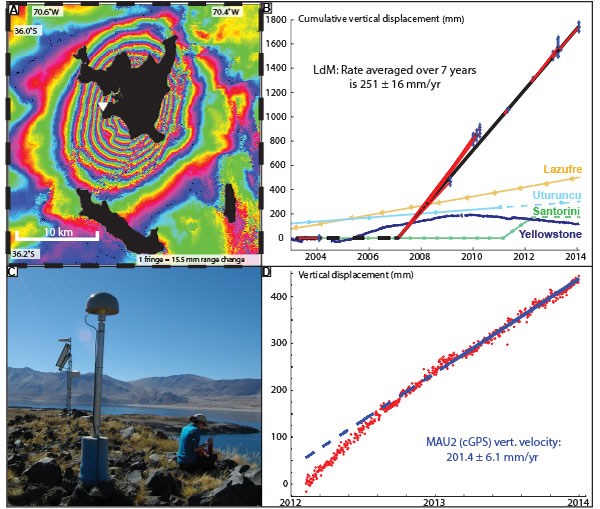
Figure 3.
(A) InSAR interferogram spanning 14 Apr. 2013 to 25 Jan. 2014. One fringe denotes 15.5 mm of range change between satellite and ground. (B) Time series of vertical uplift calculated from InSAR models using ENVISAT, ALOS, and TerraSAR-X data between 2003 and 2014 (Feigl et al., 2014 [up to 2012]). Yellowstone cGPS data are shown for comparison at station WLMY (Chang et al., 2010). Other curves are estimated from GPS and InSAR results at Lazufre and Uturuncu (Pearse and Lundgren, 2013; Henderson and Pritchard, 2013) and Santorini (Newman et al., 2012; Parks et al., 2012). Dashed lines extrapolated based on personal communication with these authors. (C) View east from the MAU2 cGPS station and the most rapidly deforming area on the west side of Laguna del Maule (photo by L. Cordova, March 2012). (D) Time series between 2012 and 2014 of relative vertical displacement for cGPS station MAU2 with respect to South America and the best-fitting velocity (blue line).