
Full Text View
Volume 21 Issue 2 (February 2011)
GSA Today
![]()
Article, pp. 4-9 | Abstract | PDF (4.6MB)
Alternative perspectives of crustal and upper mantle phenomena along the Rio Grande rift
| Table of Contents |
|---|
|
Search GoogleScholar for
Search GSA Today |
Abstract
At various locations along the Rio Grande rift in central and southern New Mexico, USA, heat flow data suggest a rather abrupt change from high values often associated with the rift to lower values characterizing neighboring geologic provinces. With this consideration in mind, we explore possible perspectives derived from seismic cross sections along La Ristra profile crossing New Mexico. In New Mexico, La Ristra transects at ~45° to the generally accepted north-south axis of the Rio Grande rift and more acutely to potential eastern boundaries of the southern rift. Considering foreshortened projections of seismic cross sections, one may be able to better visualize possible advection associated with the Rio Grande rift, although resolution of existing seismic data suggests the narrow, near vertical seismic anomalies in these projections may be hypothetical interpretations. If the foreshortened cross sections are realistic, then upper-mantle upwelling appears to be focused near the Rio Grande rift–Great Plains craton boundary.
*E-mail:
Manuscript received 26 Aug. 2009; accepted 22 Aug. 2010
DOI: 10.1130/GSATG79AR
INTRODUCTION
“Ristra is a deep-imaging seismic experiment using naturally-occurring earthquake sources” (RISTRA Research Group, 2007). Analysis of seismic data along the La Ristra profile has provided extremely valuable information regarding the seismic velocity distribution in the crust and upper mantle from southeastern New Mexico and west Texas to northeastern Arizona, USA (Fig. 1) (Gao et al., 2004; West et al., 2004; Wilson et al., 2005b). These analyses have been related to phenomena typically associated with rift tectonics, such as mantle convection and elevated temperature and partial melting conditions in the crust and upper mantle. Several considerations with respect to the resulting seismic cross sections and the relationship to the traversed geological provinces are noted (Fig. 1): (1) the seismic profile is oriented at ~45° to the generally accepted north-south axis of the Rio Grande rift; (2) south of the Albuquerque Basin, the Rio Grande rift widens considerably into east-stepping basins, including the Oscura Basin and Tularosa Basin in New Mexico and, from geomorphic studies, the Salt Basin extending into Texas; (3) the distance from La Ristra to possible eastern edges of the Rio Grande rift likely increases south of Socorro; and (4) the seismic cross sections represent a swath average of up to ~160 km on either side of La Ristra. These observations suggest that subsurface seismic changes may be unduly smoothed and broadened along La Ristra south of the intersection with the Rio Grande rift in the southern Albuquerque Basin (Fig. 1).
|
Map of La Ristra profile, geologic provinces, physiographic features, and heat flow data (modified from Pazzaglia and Hawley, 2004; Reiter, 2009). Cities (large dots) near La Ristra: A—Albuquerque; Al—Almogordo; EP—El Paso; GA—Gallup; GR—Grants; H—Hobbs; LC—Las Cruces; R—Roswell; S—Socorro. Geologic provinces outlined by white lines: BR—Basin and Range; CP—Colorado Plateau; GP—Great Plains; JL—Jemez lineament; RGRs—Rio Grande rift south; RGRn—Rio Grande rift north; RGRerf—Rio Grande rift eastern rift flank; SR—Southern Rocky Mountains. See Pazzaglia and Hawley (2004) for a complete list of physiographic features (small letters) and cities. Basins of interest: ab—Albuquerque Basin; ob—Oscura Basin; sb—Salt Basin; tb—Tularosa Basin. Dashed brown lines indicate 160 km (approx. extent of seismic swath average) and 100 km from La Ristra. Red tie lines—distance from eastern edge of Rio Grande rift to seismic stations (asterisks); red numbers along tie lines—distance (in km); seismic station numbers are in red and circled. Heat flows (black dots) presented or referenced in Decker (1975), Roy et al. (1983), Reiter et al. (1975), Shearer and Reiter (1981), Reiter and Tovar (1982), Reiter and Jordan (1996), and Reiter (2008, 2009). Three new heat flow estimates (triangles) are near the Socorro Magma Body (Reiter et al., 2010). A–A′ is straight line approximation connecting the eastern boundary of Rio Grande rift from southern Albuquerque Basin to station 3 projection on La Ristra. C–B is straight line approximation of southeast step-wise suggested thermal boundary of Rio Grande rift (gray stepping line). A–D is north-south line (see southern and southeastern New Mexico). |
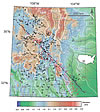 Figure 1
Relative Vs seismic cross sections show quite distinctly the extent and magnitude of anomalous seismic regions in the crust and upper mantle referenced to a standard model (Vs is shear wave velocity; relative Vs is ΔVs/Vs%, referenced to 1-D standard model AK135 in the mantle and laterally averaged structure in the crust; West et al., 2004; Fig. 2). Negative relative Vs indicates slower velocities (warmer material and/or more fluids); positive Vs implies faster velocities (cooler, more dense material). We combine and modify these crust and upper mantle relative Vs cross sections so that horizontal and vertical scales are the same and then show four different projections of the cross sections (Figs. 2A–2D). The first projection is along La Ristra; the second is normal to the north-south axis of the rift (Figs. 2A and 2B; after West et al., 2004, and Wilson et al., 2005b, respectively). The last two projections are normal to lines that approximate possible eastern boundaries of the rift southeast of Socorro (Figs. 2C and 2D); these projections imply that the thermal and structural anomalies associated with the Rio Grande rift begin near the rift boundary, although the boundary in some locations may be elusive.
|
(A) Cross section along La Ristra of relative Vs (ΔVs/Vs) referenced to 1-D standard model AK135 in mantle and laterally averaged structure in the crust (modified, making vertical and horizontal scales equal; from West et al., 2004). Relative ΔT is the estimated temperature increase above the standard model at the base of a given relative Vs zone, indicated by X. A indicates a jog or lateral shift in the relative Vs cross section. (B) Same as A but projected onto east-west line; cutout enlarges area under the rift. (C) Same as A but projected normal to C–B in Figure 1. (D) Same as A but projected normal to A–A′ and to western rift boundary where indicated (see text). CPw—Colorado Plateau wedge; JL—Jemez Lineament; RGr—Rio Grande rift; RGr(erf)—Rio Grande rift (eastern rift flank). Distance across southern Albuquerque Basin (between zeroes) is the same as along La Ristra. Relative Vs zones (%) are chosen with computer aid. Dashed line under the southern Albuquerque Basin represents pre-rift Moho, possibly deeper in the Laramide mountain belt. A indicates a jog or lateral shift in the relative Vs cross section. |
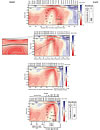 Figure 2
Brief Geological Background of the Rio Grande Rift
The Rio Grande rift is a north-trending and northward-narrowing (propagating) zone of lithospheric extension expressed in the upper crust by a series of north-south–trending en-echelon basins of middle to late Cenozoic age that extend more than 1000 km from central Colorado through New Mexico into west Texas. Beginning to develop ca. 30–35 Ma, the Rio Grande rift follows slightly older zones of weakness in the lithosphere associated with Laramide contractional welts and north-trending belts of Paleocene arc volcanism, both superimposed on basement structural grain of Proterozoic and Paleozoic ancestry (Chapin, 1979; Keller and Baldridge, 1999; Smith, 2004; van Wijk, 2005). The southern part of La Ristra skirts the northern margins of the east-stepping, actively extending basins and continues along the adjacent flanking uplifts—a region described as the “eastern rift boundary” (Pazzaglia and Hawley, 2004; Fig. 1).
The Rio Grande rift can also be defined as a region of high heat flow (Reiter et al., 1975). In the Albuquerque Basin, areas of high heat flow (>95 mW m−2) appear to be associated with zones of focused extension; the background heat flow for the Basin is ~80 mW m−2, and heat flow values drop quickly near the eastern rift boundary (Fig. 1; Reiter et al., 1975, 1986). Rather abrupt heat flow changes are also noted near the eastern rift boundary between Socorro and Alamogordo (Fig. 1). However, as discussed by Morgan et al. (1986), the eastern boundary of the southern Rio Grande rift is more elusive. For example, in the Salt Basin there is only one shallow heat flow measurement near the western boundary of the Basin (sb on Fig. 1); however, data to the southeast also suggest low heat flow west of the geomorphic rift boundary. We therefore use characteristic Basin and Range heat flows of 85 and 79 mW m−2, as well as the lower values characteristic of the Great Plains (41–50 mW m−2), to approximate a possible “thermal” rift boundary in southern New Mexico and west Texas (Fig. 1, gray stepping line).
Presentation of Cross Sections
Figure 2A shows the relative Vs cross section along La Ristra (after West et al., 2004, combining crust and mantle cross sections and illustrating equivalent horizontal and vertical scales). From this figure, one may perhaps envision a convective cell transferring heat from depth in the mantle. Figure 2B is an east-west projection of the La Ristra cross section, normal to the fundamental north-south axis of the Rio Grande rift—in the same sense that Wilson et al. (2005b) projected a different model of seismic data east-west. In Figure 2B, one may notice that a fundamental change in relative seismic velocities between the Great Plains and the Rio Grande rift occurs over a shorter distance than along La Ristra (Fig. 2A), while the visualization of possible vertical heat advection appears somewhat enhanced. The change in Moho depth between the rift and neighboring geological provinces also occurs over a shorter distance.
Figure 2C shows the La Ristra relative Vs cross section projected normal to the C–B line (see Fig. 1) south of seismic station 27 and along La Ristra north of station 27. This projection honors the heat flow values near the southeastern boundary of the Rio Grande rift in New Mexico and west Texas and is an approximation to a series of possible east-stepping boundaries of the rift (as suggested by the gray line in Fig. 1). One may note in Fig. 2C that the transition from the Great Plains (positive relative Vs) to the Rio Grande rift (station 27) occurs over a much shorter distance, ~115 km as opposed to ~350 km along La Ristra or ~245 km along the east-west projection. The image of a possible vertical advection conduit near the eastern boundary of the rift appears enhanced.
Figure 2D is a composite cross section. Between A and A′ (Fig. 1) we plot the approximate shortest distance between La Ristra and the geomorphic eastern boundary of the Rio Grande rift, which closely approximates projecting La Ristra onto a normal to A–A′ in Figure 1. West of the Rio Grande rift, we also plot the distance from the western rift boundary, but across the southern Albuquerque Basin and in northwest New Mexico, the distance is along La Ristra (Fig. 2D). Figure 2D shows somewhat more foreshortening than Figure 2C east of the rift (because the projection angle is a bit more acute), with some foreshortening west of the rift in Figure 2D. The change in Moho depth between the Rio Grande rift and the Great Plains shown in Figures 2C and 2D occurs over a much shorter distance than along La Ristra, consistent with traversing normal to the rift boundary. The “true” dip of the Moho in Figure 2D is ~22°, and the angle between La Ristra and A–A′ is ~15°; these spatial relationships yield an apparent dip of ~6° (Ragan, 1968), very similar to Moho dip along La Ristra (Fig. 2A).
Depth of Advection Considerations
As shown in six different seismic models crossing North America, the western edge of the Great Plains, near the border with the Rio Grande rift, is a first-order geological and geophysical boundary between the tectonically active western United States and the continental craton (Dziewonski, 2005, p. 152). The cold, strong crust and upper mantle of the Great Plains, distinctly shown in Figure 2 by the large positive relative Vs velocities, has resisted extension, as focused in the Rio Grande rift, while the high-viscosity mantle under the Great Plains tends to restrain convection. Upward advection occurs in regions of extension and lithosphere thinning as along the Rio Grande rift (van Wijk et al., 2008). As seen in Figures 2B–2D, upward advection could be suggested along the boundary between the Great Plains and the Rio Grande rift, roughly between seismic stations 17 and 27—although the horizontal resolution of a similar surface-wave–velocity model is ~150 km along La Ristra, or 105 km on an east-west cross section, in the upper mantle (≤150 km depth; Wilson et al., 2005b).
To consider depths from which upward advection may originate near the eastern rift boundary, we first chose the greatest Vs anomaly zones below 200 km for which a base depth could be estimated; these depths are shown as large Xs in Figures 2A and 2D. Below ~200 km partial melting is typically unexpected (Asimov, 2000); therefore, at the depths of interest (≥274 km), the Vs anomalies should be caused mainly by increased temperature. Relative Vs change as a function of depth (temperature) is given by Karato (1993); but because of the dependence on mineralogy and composition, the function may be uncertain to 30% (Julian, 2005). In Table 1, the three depths of interest (Zb), at the bases of the relative Vs anomalies, are correlated with temperatures from an average geotherm for the mantle above the transition zone (Jeanloz, 2000) to yield corresponding temperatures [T(Geo)]. Temperature increases (including uncertainties) are estimated from relative Vs as a function of depth-temperature (Karato, 1993). These temperature increases (ΔT, Table 1; relative ΔT, Fig. 2) are added to T(Geo) to estimate the present temperatures at the base of the anomalous Vs zones (Table 1; T with uncertainty limits T min and T max).
|
Relationship Between Relative Vs and Temperature Increase, Estimate of Possible Advection Depth |
 Table 1
From mantle geotherm estimates to the base of the transition zone (Jeanloz, 2000), the estimated present temperatures (T) correspond to depths Z (Table 1) on the upwelling geotherm of Jeanloz (2000; the average geotherm temperature would place the estimated depth below the transition zone). The average of these three depth estimates is ~624 ± 32 km. The upper temperature limit estimates (T max) place the corresponding depths (Z max) below the bottom of the transition zone at 660 km. The lower limiting temperatures (T min) are correlated to depths from both the upwelling and average geotherms (Jeanloz, 2000; Table 1, Z min, Upw [upwelling] and Ave [average]). These depth estimates average 496 ± 48 km and 590 ± 47 km, respectively. Recognizing the large uncertainties in the change of Vs with temperature, and in estimated mantle geotherms, we suggest that upwelling originates in, or possibly crosses, the transition zone. The medial value of Z suggests upwelling from the lower transition zone (Table 1, Z Upw).
The difference between the upwelling geotherm and the average geotherm is ~180 °C at 410-km depth and ~80 °C at 650 km (Jeanloz, 2000). A temperature increase of 100 °C depresses the 410-km discontinuity by ~8 km and raises the 660 km discontinuity by ~5 km (with considerable uncertainties; Julian, 2005). We may therefore anticipate a depression of ~14 km at the 410-km discontinuity and a shallowing of the 660-km transition by ~4 km if upwelling indeed represents the present in-situ geotherm for the upward advection conduit as suggested in Figure 2 below ~200 km. Along La Ristra, small undulations of the 410 km and 660 km discontinuities are noted (Wilson et al., 2005a); from that study, we observe ~20-km deepening of the 410-km discontinuity and perhaps ~6 km shallowing of the 660-km discontinuities between seismic stations 15 and 21. This observation may be consistent with upwelling and our estimates of advection-increased temperatures.
Discussion
La Ristra traverses ~45° to the north-south axis of the Rio Grande rift and more acutely to potential southeastern boundaries of the rift. Swath averaging of data to ~160 km on either side of the profile also implies imaging different amounts of neighboring geologic provinces at different stations; that is, moving along La Ristra from the southeast to the northwest, the amount of the Great Plains included in the averaged cross section gradually decreases while the amount of the Rio Grande rift and its eastern rift flank gradually increases. These considerations suggest that apparent broadening of the transition boundary between the Rio Grande rift and the Great Plains along La Ristra is a matter of perspective. Possible jogs (lateral shifts) in the relative Vs cross section may also occur between stations where the distance to the rift changes markedly; e.g., the jog at ~220 km depth in the −5.4% relative Vs zone occurs where the distance to the rift margin changes rapidly between stations 19 and 23 (A on Figs. 2A and 2D).
Our different projections show modest changes in the cross sections west of the Rio Grande rift because La Ristra is nearly normal to the trend of the Jemez Lineament, a young, mantle-fed volcanic zone bordering the rift, and thus differences between distances along La Ristra and seismic stations to the western rift boundary are much less than along the southeast profile. The most obvious feature of the different La Ristra projections is a potentially better visualization of a possible upward advection conduit along the eastern boundary of the Rio Grande rift. This perspective is generally compatible with models showing a distinct mantle seismic discontinuity near the eastern boundary of the Rio Grande rift (Dziewonski, 2005; West et al., 2004). High velocities east of the rift indicate a cooler, stronger mantle resistive to advection, thereby guiding an asymmetrical flow system that appears to rise near the eastern rift margin and may descend west of the rift axis. The overall cross sections suggest this asymmetrical flow system; however, present seismic data may not be able to resolve the narrow seismically anomalous zones suggested in Figures 2C and 2D (Dziewonski, 2005), and therefore these projections are viewed only as possibilities.
In all of the projections, a very prominent negative relative Vs zone (−6.4%) appears in the upper mantle from ~50–80-km depth under the southern Albuquerque Basin (Fig. 2). This depth is consistent with a heat source proposed from heat flow data (Reiter, 2009) and, therefore, this slow Vs anomaly should result from both elevated temperatures as well as partial melting. Below the −6.4% relative Vs zone, the magnitude of negative relative Vs decreases with depth, and at ~250 km, relative Vs becomes positive. Relating relative Vs to temperature and partial melting would suggest that this observed pattern is not characteristic of typical diapir upwelling, which should maintain elevated temperatures in the rising advection column. Passive upwelling of sub-adiabatic upper mantle material or compositional heterogeneities in the upper mantle have been suggested as possible alternative conditions supporting upwelling under the rift (West et al., 2004; van Wijk et al., 2008).
Above the −6.4% relative Vs zone, the magnitude of negative relative Vs also decreases upward to the Moho, as below the −6.4% zone (Fig. 2B, cutout). From these observations, we suggest that the most anomalous zone in the upper mantle results from mass flux and associated partial melting below 50 km. In Figures 2B–2D, upwelling suggested between stations 22 and 26 appears to be a potential conduit feeding warmer, decompressionally partial melted material to the eastern part of the most anomalous relative Vs zone (−6.4%).
In Figure 2B (cutout), a mid-crustal relative Vs anomaly is shown directly above the most anomalous zone in the upper mantle. The mid-crustal anomaly is spatially nearly coincident with the Socorro Magma Body (Balch et al., 1997), and likely represents a series of basaltic intrusions derived from the upper mantle anomalous Vs (−6.4%) region during Pliocene-Pleistocene time (West et al., 2004; Reiter et al., 2010).
Acknowledgments
We thank Leo Gabaldon and Phillip Miller for considerable help in preparing the figures. We thank D. Fastovsky, D. Love, P. Morgan, A. Sanford, and another reviewer for helpful discussions and comments on the manuscript.
REFERENCES CITED
- Asimov, P.D., 2000, Melting the mantle, in Sigurdsson, H., ed., Encyclopedia of Volcanoes: San Diego, Academic Press, p. 55–68.
- Balch, R.S., Hartse, H.E., Sanford, A.R., and Lin, K., 1997, A new map of the geographical extent of the Socorro mid-crustal magma body: Bulletin of the Seismological Society of America, v. 87, p. 174–182.
- Chapin, C.E., 1979, Evolution of the Rio Grande rift—A summary, in Riecker, R.E., ed., Rio Grande rift: Tectonics and magmatism: Washington, D.C., American Geophysical Union, p. 1–7.
- Decker, E.R., Cook, F.A., Ramberg, I.B., and Smithson, S.B., 1975, Significance of geothermal and gravity studies in the Las Cruces area, in Seager, W.R., Clemons, R.E., and Callender, J.F., eds., Las Cruces Country: New Mexico Geological Society 26th Field Conference, p. 251–259.
- Dziewonski, A.M., 2005, The robust aspects of global seismic tomography, in Foulger, G.R., Natland, J.H., Presnall, D.C., and Anderson, D.L., eds., Plates, Plumes, and Paradigms: Geological Society America Special Paper 388, p. 147–154.
- Gao, W., Grand, S.P., Baldridge, W.S., Wilson, D., West, M., Ni, J.F., and Aster, R., 2004, Upper mantle convection beneath the central Rio Grande rift imaged by P and S wave tomography: Journal of Geophysical Research, v. 109, doi: 10.1029/2003JB002743.
- Jeanloz, R., 2000, Mantle of the Earth, in Sigurdsson, H., ed., Encyclopedia of Volcanoes: San Diego, Academic Press, p. 44–54.
- Julian, B.R., 2005, What can seismology say about hot spots, in Foulger, G.R., Natland, J.H., Presnall, D.C., and Anderson, D.L., eds., Plates, Plumes, and Paradigms: Geological Society America Special Paper 388, p. 155–169.
- Karato, S.I., 1993, Importance of anelasticity in the interpretation of seismic tomography: Geophysical Research Letters, v. 20, p. 1623–1626.
- Keller, G.R, and Baldridge, W.S., 1999, The Rio Grande rift: A geological and geophysical overview: Rocky Mountain Geology, v. 34, p. 121–130.
- Morgan, P., Seager, W.R., and Golombeck, M.P., 1986, Cenozoic thermal, mechanical, and tectonic evolution of the Rio Grande rift: Journal of Geophysical Research, v. 91, p. 6263–6276.
- Pazzaglia, F.J., and Hawley, J.W., 2004, Neogene (rift flank) and Quaternary geology and geomorphology, in Mack, G.H., and Giles, K.A., eds., The Geology of New Mexico: New Mexico Geological Society Special Publication 11, p. 407–437.
- Ragan, D.M., 1968, Structural Geology: An Introduction to Geometrical Techniques: New York, John Wiley & Sons, 169 p.
- Reiter, M., 2008, Geothermal anomalies in the crust and upper mantle along Southern Rocky Mountain transitions: GSA Bulletin, v. 120, p. 431–441, doi: 10.1130/B26198.
- Reiter, M., 2009, Heat flow anomalies crossing New Mexico along La Ristra seismic profile: Lithosphere, v. 1, p. 88–94, doi: 10.1130/L1.1.
- Reiter, M., and Jordan, D., 1996, Hydrogeothermal study across the Pecos River Valley, southeast New Mexico: GSA Bulletin, v. 108, p. 747–756.
- Reiter, M., and Tovar, R.J.C., 1982, Estimates of terrestrial heat flow in northern Chihuahua, based upon petroleum bottom hole temperatures: GSA Bulletin, v. 93, p. 613–624.
- Reiter, M., Edwards, C.L., Hartman, H., and Weidman, C., 1975, Terrestrial heat flow along the Rio Grande rift, New Mexico and southern Colorado: GSA Bulletin, v. 86, p. 811–819.
- Reiter, M., Eggleston, R.E., Broadwell, B.R., and Minier, J., 1986, Estimates of terrestrial heat flow from deep petroleum tests along the Rio Grande rift in central and southern New Mexico: Journal of Geophysical Research, v. 91, p. 6225–6245.
- Reiter, M., Chamberlin, R.M., and Love, D.W., 2010, New data reflect on the thermal antiquity of the Socorro magma body locale, Rio Grande rift, New Mexico: Lithosphere, v. 2, p. 447–453, doi: 10.1130/L115.1.
- RISTRA Research Group, 2007, Colorado Plateau/Rio Grande Rift Seismic Transect Experiment (LA RISTRA): (last accessed 25 Aug. 2010).
- Roy, R., Taylor, B., and Miklas, M.P., Jr., 1983, Geothermal exploration in Trans-Pecos, Texas/New Mexico: Dept. of Energy Final Report, DOE/ID/12080-T1, 121 p.
- Shearer, C., and Reiter, M., 1981, Terrestrial heat flow in Arizona: Journal of Geophysical Research, v. 86, p. 6249–6260.
- Smith, G.A., 2004, Middle to late Cenozoic development of the Rio Grande rift and adjacent regions in northern New Mexico, in Mack, G.H., and Giles, K.A., eds., The Geology of New Mexico: New Mexico Geological Society Special Publication 11, p. 331–358.
- van Wijk, J.W., 2005, Role of a weak zone orientation in continental lithosphere extension: Geophysical Research Letters, v. 32, doi: 10.1029/2004GL022192.
- van Wijk, J.W., van Hunen, J., and Goes, S., 2008, Small scale convection during continental rifting: Evidence from the Rio Grande rift: Geology, v. 36, p. 575–578, doi: 10.1130/G24691A.1.
- West, M., Ni, J., Baldridge, W.S., Wilson, D., Aster, R., Gao, W., and Grand, S., 2004, Crust and upper mantle shear wave structure of the southwest United States: Implications for rifting and support for high elevations: Journal of Geophysical Research, v. 109, doi: 10.1029/2003JB002575.
- Wilson, D., Aster, R., Ni, J., Grand, S., West, M., Gao, W., Baldridge, W.S., and Semken, S., 2005a, Imagining the seismic structure of the crust and upper mantle beneath the Great Plains, Rio Grande rift, and Colorado Plateau using receiver functions: Journal of Geophysical Research, v. 110, doi: 10.1029/2004JB003492.
- Wilson, D., Aster, R., West, M., Ni, J., Grand, S., Gao, W., Baldridge, W.S., Semken, S., and Plate, P., 2005b, Lithospheric structure of the Rio Grande rift: Nature, v. 433, p. 851–855.