
Full Text View
GSA Today
![]()
Article, pp. 4-10 | Abstract | PDF (859KB)
The impact of snowmelt on the late Cenozoic landscape of the southern Rocky Mountains, USA
| Table of Contents |
|---|
| Search GoogleScholar for
Search GSA Today |
The intramontane basins of the southern Rocky Mountains, USA, have undergone up to 1.5 km of erosion from the middle Miocene to the present. Here I explore the hypothesis that this erosion could have been caused primarily by an increase in the intensity of snowmelt flooding. In the middle Miocene, snowmelt runoff was limited to the highest elevations (>3 km) and hence impacted only a small fraction of the regional landscape. As the global climate system cooled during the late Miocene and Plio-Quaternary periods, the fraction of total river discharge derived from snowmelt increased significantly in areas between 1.5 and 3 km elevation, thereby increasing the magnitude of flooding during periods of snowmelt and the resulting bedload sediment flux and erosion of rivers in that elevation range. In this paper, the fraction of modern discharge derived from snowmelt is used, together with an assumed lapse rate, to map the change in snowmelt discharge and sediment flux through time from the middle Miocene to the Quaternary in the southern Rocky Mountain region. These data are then used as input to a landscape evolution model that maps the spatial distribution of late Cenozoic snowmelt-driven erosion in the region. The model predicts a spatial distribution of erosion that broadly matches the actual distribution determined from geographic information system (GIS) analyses and dated basin-fill remnants. In the model, a factor-of-four increase in sediment flux within the 1.53 km elevation range, well within reasonable estimates, is capable of producing the observed magnitude of late Cenozoic erosion in the region. The longitudinal profiles of major rivers sourced from the southern Rocky Mountains are also modeled through time in order to better understand the downstream response to intramontane basin erosion. Model results indicate that erosion would have triggered widespread deposition downstream from those basins, which is broadly consistent with the magnitude, timing, and spatial distribution of the Ogallala Formation. The results of this study suggest that snowmelt-driven erosion may be an important component of late Cenozoic landscape evolution in mid- to high-elevation regions worldwide.
Manuscript received 19 January 2009; accepted 10 April 2009.
doi: 10.1130/GSATG44A.1
*E-mail:
INTRODUCTION
The intramontane basins of the southern Rocky Mountains have undergone up to 1.5 km of erosion in the late Cenozoic (McMillan et al., 2006). A particularly vivid illustration of this erosion is found in the Bighorn Basin. Figure 1 illustrates the view near Cody, Wyoming, USA, where the North Fork Shoshone River has incised at least 800 m into the Eocene Willwood Formation (near horizon) and lower units, exposing sediments as old as Triassic. Shale maturation data suggest that Cenozoic erosion in this area could have been as great as 1.5 km (Heasler and Kharitonona, 1996), indicating that the thickness of basin fill sediments could have been much greater than the 800 m exposed in Figure 1. Broad, low-relief Quaternary strath terraces illustrate that local downcutting took place episodically, followed by periods of lateral erosion (Mackin, 1937; Hancock and Anderson, 2002). Dated basalt flows within basin fill remnants indicate that most of this erosion took place from the late Miocene to the present (McMillan et al., 2006).
|
View of the Bighorn Basin near Cody, Wyoming, USA. The North Fork Shoshone River has incised a minimum of 800 m into the Eocene Willwood Formation (near horizon), down to the level of the modern river, exposing sediments as old as Triassic (m a.s.l.meters above sea level). |
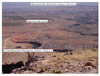 Figure 1
The Bighorn Basin is not unique—significant magnitudes of late Cenozoic erosion took place in all of the intramontane basins of the southern Rocky Mountains. McMillan et al. (2006) used GIS techniques and dated basin-fill remnants to map the spatial distribution of minimum erosion in the region and found that up to 1.5 km of late Cenozoic erosion occurred in the southern Rocky Mountain intramontane basins. McMillan et al.s (2006) map provides only minimum estimates for erosion, however, due to incomplete preservation of basin-fill deposits. The greatest erosion took place in the central portion of the southern Rocky Mountains, with values decreasing toward the Great Plains to the east and the Colorado Plateau to the southwest. Working in the Colorado Plateau, Pederson et al. (2002) used similar techniques to map the magnitude and spatial distribution of erosion and obtained broadly similar estimates to those of McMillan et al. (2006).
One of the most remarkable aspects of the late Cenozoic erosion of the southern Rocky Mountain region is that so much of the erosion occurred in the broad, low-relief intramontane basins, challenging the prevailing notion that erosion rates are necessarily greater in areas of high-relief and/or high-elevation. Limited data exist on erosion rates in the high peaks of the southern Rockies and adjacent ranges, but available data suggest that the peaks have eroded much more slowly than the basins. In the Pleistocene, for example, the highest portions of the Wind River Range have eroded at rates of 0.0050.015 m/ka (Small et al., 1997), while the adjacent basins have eroded at rates approximately ten times higher (i.e., up to 0.3 m/ka; Dethier, 2001; Heffern et al., 2007). Low-temperature thermochronologic data indicate that erosion of the high peaks has been similar to the rates measured by Small et al. (1997) throughout the Cenozoic (Crowley et al., 2002). Similarly, stable-isotope paleoaltimetry (Dettman and Lohmann, 2000; Mulch et al., 2004; Kent-Corson et al., 2006) and leaf margin analysis (Wolfe et al., 1998) suggest that peak elevations in the southern Rocky Mountains have undergone relatively little change in the Cenozoic. Alluvial rivers east of the Continental Divide have seen no significant change in base level during the Cenozoic as the Mississippi River has drained into the Gulf of Mexico. Basins west of the Continental Divide became adjusted to a base level at or close to that of the Kaibab Limestone (i.e., the rim surface of Grand Canyon) by the middle Miocene (Young, 2008). Recent erosion of Grand Canyon has triggered upstream propagation of a knickpoint, but the intramontane basins of the Colorado Plateau have not yet been affected by this base-level change (Karlstrom et al., 2008). The emerging view, therefore, is one in which most of the high and low elevations of the region have eroded at relatively slow rates and have undergone little change in elevation, while the intermediate elevations (1.53 km) have undergone much higher rates of erosion despite the broad, gently sloping nature of the topography.
Epeirogenic uplift is one traditional explanation for the erosion of the southern Rocky Mountain intramontane basins and the deposition of the adjacent Ogallala Formation (Epis and Chapin, 1975; Trimble, 1980; Diffendal, 1982; Eaton, 1987, 2008; McMillan et al., 2006; Riihimaki et al., 2007). Epeirogenic uplift, however, is difficult to reconcile with paleoaltimetric data showing Cenozoic peak elevations as high or higher than today given the apparently slow rates of summit erosion. Climate change has been invoked as an alternative explanation for the late Cenozoic erosion of the southern Rocky Mountain region specifically (Gregory and Chase, 1994; Zaprowski et al., 2001, 2005) and for late Cenozoic river erosion worldwide (Molnar, 2001). The impact of climate change on rivers can take on a number of different scenarios, but these studies cite an increase in the frequency of intense rainfall during the late Cenozoic transition to a more arid climate as the primary mechanism. More arid climates put less total water on the landscape per unit time, but they do so in larger, more geomorphically effective floods. Larger floods transport disproportionately more sediment due to the nonlinear relationship between sediment flux and discharge in alluvial rivers (Wolman and Miller, 1960). The key question, then, is which of these two opposing effects (less water or more intense storms) dominates? Existing climatically driven models for late Cenozoic erosion have not fully answered this question. Gregory and Chases (1994) argument is based on a landscape evolution model in which discrete units of runoff occur in each cell and the erosion due to each unit of runoff is treated independently. Their model, therefore, includes only the effects of isolated thunderstorm-type events and does not adequately model the effects of large, spatially extensive flood events. Molnar (2001) used a power-law frequency-size distribution for discharge, together with a nonlinear sediment transport relationship, to illustrate the geomorphic effectiveness of extreme flood events. A later analysis by Molnar et al. (2006), however, concluded that greater aridity does not, in general, lead to higher sediment transport rates. Given these uncertainties, it is unclear how, or even whether, climate change is capable of causing large-magnitude erosion in the absence of active uplift.
HYDROCLIMATOLOGICAL ANALYSIS
Many subalpine rivers in the western United States experience their greatest flooding during spring and/or summer periods of snowmelt discharge (Troendle et al., 1996; Merz et al., 2006; Dyer, 2008). These warm-season floods are primarily a late Cenozoic phenomenon because warmer temperatures in the early to middle Miocene would have limited snowmelt runoff to only the highest elevations (i.e., >3 km). Figure 2A illustrates the relationship between the seasonality of precipitation (filled circles), discharge (open circles), and elevation in the southern Rocky Mountain region. The seasonality of precipitation, Sp, defined as the ratio of precipitation (including snow water equivalent) in the wettest three consecutive months to precipitation in the driest three consecutive months, was computed from parameter-elevation regressions on independent slopes model (PRISM) mean monthly 1 km/pixel grids (Daly et al., 1994) for the southern Rocky Mountain region. Seasonality values were then averaged in 10-m elevation bins from 1 to 3.5 km elevation to isolate the effects of elevation. These data illustrate that SP is between 2 and 7, with high-elevation regions experiencing, on average, lower seasonality values. Values for the seasonality of discharge, SQ, computed using undammed U.S. Geological Survey gaging stations, are similar to SP values for elevations lower than ~1.5 km but increase significantly (to as high as 15) at high elevations (see supplementary data item 20091621). The difference between the seasonality of precipitation and discharge is largely attributable to snowmelt runoff.
|
Measured and modeled relationships between hydroclimatology and elevation in the southern Rocky Mountain region. (A) Plots of seasonality of precipitation, Sp (filled circles), seasonality of discharge, SQ (open circles), and the ratio of long-term bedload sediment flux for an elevated model basin to the same basin at 1 km elevation, qs(h)/qs(1) (crosses), as a function of elevation, h. (B) Plot of the snow ratio, Rs (i.e., the fraction of discharge derived from snowmelt for modern climate conditions [dots] and estimated curves for mean Quaternary conditions and middle Miocene conditions, assuming the same empirical function [equation {1}]) as modern conditions and a lapse rate of 6 °C/km. Inset graph (after Zhang et al., 2001) plots δ18O from deep-sea sediment cores, illustrating global cooling events at ca. 15 and 4 Ma. |
 Figure 2
The geomorphic impact of sequestering precipitation during cold-season months and releasing it during warm-season months can be illustrated with a simple hypothetical example. Consider a drainage basin that transports 1 kg/s of sediment as bedload, has no snowmelt runoff and, for simplicity, a constant discharge of 10 m3/s throughout the year. Now imagine the same drainage basin under a cold-climate scenario in which all of the precipitation that falls during the autumn, winter, and spring months is released as a constant discharge in the summer months as snowmelt runoff. Discharge during the summer would then be 40 m3/s. Bedload sediment flux is a power-law function of discharge with exponent values (i.e., the bedload rating exponent) ranging from 2 to 5 (Emmett and Wolman, 2001). Assuming a bedload rating exponent of 2, the sediment flux in our hypothetical cold-climate drainage basin would be 16 kg/s during the summer or 4 kg/s on a mean annual basis (i.e., four times greater than the same basin under a warm-climate scenario).
This hypothetical example greatly oversimplifies the complexity of the hydrological and geomorphic consequences of snowmelt runoff. However, a more sophisticated analysis that incorporates a realistic frequency-intensity distribution of rainfall and thaw-driven runoff yields broadly similar results. I used the HydroTrend model of Kettner and Syvitski (2008) to quantify the ratio of the long-term bedload sediment flux of a high-elevation model drainage basin to the same basin at low elevation, assuming a lapse rate (i.e., slope of the temperature versus elevation relationship) of 6 °C/km. In this analysis, the bedload sediment flux was first calculated for a hypothetical drainage basin with an area of 100 km2, an outlet elevation of 1 km, a uniform elevation-area relationship, and a relief of 500 m subject to realistic stochastic models of temperature and precipitation. The model assigns daily precipitation to rain or snow depending on whether the temperature is above or below freezing, respectively. Warm-season snowpack thaw is modeled, producing snowmelt flooding. The elevation of this hypothetical basin was then increased in 500-m intervals up to an outlet elevation of 3.5 km, and the bedload sediment flux was recalculated in order to compute the ratio of long-term bedload sediment flux for the elevated basin to that of the original basin, qs(h)/qs(1). The resulting data plotted in Figure 2A show that qs(h)/qs(1) increases from a value of 1 at h = 1 km (by definition) to a value of 3.6 at h = 3.5 km, assuming a bedload rating exponent of 3. The value of 3.6 is not unique, however, and varies from 2 to 8 depending on the bedload rating exponent, the frequency-intensity distribution of precipitation, and the seasonalities of temperature and precipitation (see supplementary data [footnote 1]). The results of this analysis illustrate that snowmelt flooding can lead to a significant increase in long-term bedload sediment flux, and that snowmelt-driven transport increases with elevation (i.e., with the fraction of discharge derived from snowmelt).
The next step in modeling the spatially distributed geomorphic response to snowmelt flooding is to estimate the fraction of discharge derived from snowmelt as a function of elevation through the late Cenozoic. The filled circles in Figure 2B illustrate the fraction of discharge derived from snowmelt, Rs, as a function of elevation calculated using PRISM gridded data sets (Daly et al., 1994). First, PRISM data sets for mean monthly temperature and precipitation were used to create daily time series data for precipitation and temperature analogous to those produced by HydroTrend. The difference in this step of the analysis is that time series data were produced explicitly for each 1 km2 pixel in the Rocky Mountain region based on site-specific data for monthly mean values. The modeled volumes of snow (or, properly, snow-water equivalent) and rain were then routed downstream through a 1 km/pixel digital elevation model (DEM) of the region, and the ratio of the total volume of snow to the total volume of all precipitation draining through each pixel was calculated. Then, the ratios of discharge as snowmelt for all channels with a contributing area >1000 km2 were averaged in 10-m elevation bins to obtain a relationship between river elevation and the fraction of discharge derived from snowmelt. I used only data from large (>1000 km2) rivers in this analysis because, during periods of river incision, large rivers migrate laterally and hence can be expected to dominate the erosional behavior of the intramontane basins relative to small rivers. The resulting data (Fig. 2B) follow a sigmoidal or S-shaped curve as a function of elevation that is well represented by the empirical function
 (1)
(1)
with h50 = 2 km and hrange = 300 m, where h50 is the elevation at which Rs = 0.5, and hrange is the elevation range above and below h50 over which the ratio decreases or increases from 0.5 by a factor of e. Using this modern snow-ratio curve as a reference, past snow-ratio curves can be estimated assuming a lapse rate of 6 °C/km, shifting the value of h50 up or down by an amount consistent with the observed temperature change. Climate reconstructions for the late Cenozoic (inset graph, Fig. 2B) indicate that global temperature cooled by ~3 °C from the late Miocene to the Pliocene and by another 6 °C from the Pliocene to Pleistocene full-glacial conditions (Fig. 2B). To estimate the snow-ratio curve for mean Quaternary conditions, I assumed that the average Quaternary temperature was 3 °C cooler than modern conditions (i.e., halfway between Holocene and latest Pleistocene temperatures), yielding h50 = 1.5 km. The snow-ratio curve for the middle Miocene can be estimated by shifting h50 up to 2.5 km because the middle Miocene global temperature was ~6 °C warmer than the mean Quaternary temperature. The difference between the middle Miocene and mean Quaternary snow ratio curves in Figure 2B identifies 1.53 km as the elevation range that experienced the most significant changes in late Cenozoic snow-ratio values (i.e., ≥0.5).
GEOMORPHIC ANALYSIS
Models for the evolution of fluvial channels come in two basic types: transport-limited and detachment-limited. I assume that the channels incising into the early Cenozoic and Mesozoic sediments of the southern Rocky Mountain intramontane basins and points downstream are transport-limited channels. This assumption is consistent with the weakly consolidated nature of these sediments and with previous modeling studies (e.g., Hancock and Anderson, 2002). The long-term volumetric sediment flux per unit channel width, qs, in transport-limited channels is proportional to the average unit stream power, i.e., the product of mean unit discharge and channel slope (e.g., Dade and Friend, 1998):
![]() , (2)
, (2)
where Q is mean discharge, w is channel width, S is channel slope, and κ is a transport coefficient that includes the effects of grain size and density, the frequency-size distribution of flooding, and snowmelt runoff. Both κ and S are written explicitly as functions of space and time to clarify steps in the analysis. Here I assume that Q/w is a power-law function of A with exponent m, so that (2) can be written as
![]() . (3)
. (3)
The modeling strategy is to use the data in Figure 2 to quantify the relative change in transport coefficient κ as a function of space and time in the southern Rocky Mountain region and then reconstruct the paleoslopes and paleotopography associated with those changes in κ. The form of (2) shows that, if Q/w and qs remain constant, the relative changes in channel slope are inversely proportional to the relative changes in the transport coefficient κ. Expressed mathematically, this implies that, given modern channel slopes S(x,y,t0), paleoslopes at a previous time, t1, can be calculated as
![]() . (4)
. (4)
It is unlikely that mean unit discharge and sediment flux are, in fact, constant over any length of geologic time, but by assuming they are constant, I can isolate the effects of snowmelt-driven changes in κ separately from other possible mechanisms for erosion. The results of the hydroclimatological analyses above suggest that the transport coefficient κ increases proportionately to the snow ratio Rs:
![]() , (5)
, (5)
where c is a coefficient of proportionality equal to the variation in sediment transport per unit change in snow ratio. The linear relationship between κ and Rs expressed in (5) follows from the fact that the transport efficiency κ is equal to the ratio qs(h)/qs(1), and the results in Figure 2 indicate that qs(h)/qs(1) and Rs have the same sigmoidal shape. The value of c is a constant (independent of elevation) that represents the factor increase in qs(h)/qs(1) for a unit increase in Rs. The value of c is not precisely constrained, but HydroTrend modeling suggests that c = 4 is a reasonable reference value assuming a bedload rating exponent of 3. Substituting (5) into (4) gives an equation for the paleoslopes at a previous time, t1, as a function of the modern topography and the modern and past snow-ratio curves:
![]() . (6)
. (6)
The model-predicted paleotopography can then be obtained by integrating the new slope values pixel-by-pixel upstream starting from the base-level boundary conditions (e.g., h = 0 at the Gulf of Mexico and h = 1000 m at the Kaibab rim surface of Grand Canyon). By calculating the difference between the paleotopography and the modern topography, an erosion map is predicted based on the difference between the channel profiles calculated for time t1 based on the slopes at time t0 (i.e., the modern topography). Areas with a modern elevation above 2700 m and those draining to the Great Basin or Pacific Northwest were not included in the analysis. Areas currently above 2700 m are predominantly resistant bedrock and hence the transport-limited model of this paper does not apply.
Predicted late Cenozoic erosion in the model (Fig. 3) varies from ~0.5 km to 1.5 km, with generally lower values in the low-elevation basins (Powder River, Bighorn, Uinta, San Juan, Paradox) and higher values in the high-elevation basins (Wind River, Green River, Piceance). This map is broadly similar to the geologically inferred erosion map of McMillan et al. (2006), both in terms of magnitude and spatial distribution (see supplemental data for further discussion of Fig. 3 [footnote 1]). Since (6) is a linear equation, the magnitude of erosion predicted by the model is proportional to the value of c. As a result, Figure 3 can also be interpreted as a map of relative erosion per unit c. For every unit increase in the value of c above 1, ~500 m of peak erosion is predicted by the model.
|
Color map of model-predicted late Cenozoic erosion in the southern Rocky Mountain region, obtained by integrating paleoslopes calculated using equation (6) with c = 4. Erosion in the model varies from ~0.5 km to 1.5 km, with generally lower values in low-elevation basins (Powder River, Bighorn, Uinta, San Juan, Paradox) and higher values in higher-elevation basins (Wind River, Green River, Piceance). This map is broadly similar to the geologically observed erosion map of McMillan et al. (2006) both in terms of magnitude and spatial distribution. Also shown, in gray, is the approximate extent of remnants of the Ogallala Formation. |
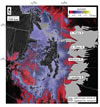 Figure 3
Erosion of the Rocky Mountain intramontane basins would have delivered a pulse of sediment to downstream rivers beginning at 15 Ma. These downstream rivers, adjusted to smaller, middle-Miocene sediment loads, would have aggraded in response to the increase in sediment delivered from the intramontane basins. Here I model this dynamic downstream response to late Cenozoic incision upstream using a two-dimensional (2-D) model framework based on conservation of mass:
![]() . (7)
. (7)
Equation (7) can be solved for a specified model domain given an initial condition h(x) and appropriate boundary conditions. My focus is on channels east of the Continental Divide, which drain from the southern Rocky Mountains to the Gulf of Mexico over distances ranging from ~25003500 km. The appropriate boundary conditions are constant base level at the downstream end of the system [i.e., h(L) = 0, where L is taken to be 3000 km as a representative value, and a constant sediment supply from upstream hillslopes and bedrock channels]. As before, it is unlikely that qs is constant over geologic time scales, but by assuming a constant qs, I can separate the effects of an increase in the value of κ from other mechanisms for deposition. An appropriate initial condition for the model can be obtained by integrating (2) for constant qs:
![]() , (8)
, (8)
where x′ is a variable of integration, the basin area is assumed to be proportional to the square of the distance from the divide, and the constant of proportionality between x2 and A is incorporated into κ. Assuming m = 1/2, (8) can be integrated to yield
![]() (9)
(9)
(i.e., a logarithmic function of x). The middle Miocene sediment flux is unknown, but the maximum elevation of pre-erosion basin fill can be estimated to be ~1.5 km higher than modern basin elevations given the results in Figure 3, giving the initial condition
![]() , (10)
, (10)
where h0 = 3.5 km, and x0 = 10 km is a representative distance downstream from the Continental Divide to where alluvial channels begin. Given (10), the incoming sediment flux at the upstream boundary can be computed from (2) to match the sediment flux within the river profile, thereby giving self-consistent initial and boundary conditions for a channel adjusted to carry the middle Miocene sediment flux delivered from upstream. The initial and upstream boundary conditions calculated in this way were input into the model with no change in κ to verify that no erosion or deposition took place. An appropriate value for the product of the middle-Miocene transport coefficient and distance downstream, κx, can be determined from a relationship that depends on discharge and river type (Paola et al., 1992). Values for braided and meandering rivers range between 104 and 105 (m2/a) for a catchment length of 100 km. Here I use κ = 0.1 m/a, which translates into a value of 105 m2/a for the product κx at a distance of 100 km from the Continental Divide (i.e., within the range that Paola et al. [1992] proposed). In the model, the κ(h) values are changed instantaneously at t = 15 Ma from middle Miocene values (i.e., h50 = 2.5 km; hrange = 300 m, with a reference value of 0.1 m/a) to mean Quaternary values (h50 = 1.5 km; hrange = 300 m) assuming c = 4.
Figure 4 illustrates the longitudinal-profile evolution predicted by the model plotted in 3-million-year increments from 15 Ma to the present. Note the logarithmic scale on the x axis: The river profile is actually concave even though on these scales it appears linear. Erosion in the 1.53.5 km range triggers deposition downstream in the model. As time progresses, the depositional wedge thickens to a maximum value of 100 m (inset plot, Fig. 4) and progrades downstream while, simultaneously, erosion is initiated at the upstream end of the deposit. The final model profile is similar to, but slightly steeper than, modern river profiles in the region, as illustrated by comparison with the Yellowstone and Arkansas rivers (and the rivers into which they drain, up to distances of 3000 km from the Continental Divide) in Figure 4. The results of the model are relatively insensitive to the specific values of h0 and x0; changes in these values within reasonable limits yield only slight differences in the predicted depositional thicknesses.
|
Figure 4. Model-predicted evolution of the longitudinal profiles of alluvial channels draining the southern Rocky Mountain intramontane basins to the Gulf of Mexico. Note logarithmic scale on x axis. The initial condition for the model (at 15 Ma) is a steady-state logarithmic profile (equation [10]). Snowmelt-driven erosion into the headwaters of the model domain (i.e., the elevation range from 1.5 to 3.5 km) delivers a pulse of sediment that triggers aggradation in downstream channels, which were adjusted to prelate-Miocene conditions of lower sediment supply. The profiles of the Yellowstone and Arkansas rivers, plotted as a function of distance x downstream from the Continental Divide, are shown for comparison. Inset plot illustrates the cross section of the model-predicted deposit at 0 Ma, shown with linear scales. The portion of the deposit greater than 30 m in thickness is located 3001200 km downstream from the Continental Divide, is lenticular in shape, and has a maximum thickness of just over 100 m. |
 Figure 4
The timing, spatial distribution, and magnitude of deposition predicted by the model are all broadly similar to the fluvial sediments of the Ogallala Formation. Deposition of the Ogallala Formation (extent of remnants shown in Fig. 3) began ca. 17 Ma (Izett, 1975; Naeser et al., 1980) on an eroded surface of Triassic and Permian age rocks and Cretaceous and Jurassic age sediments (Diffendal, 1982) and continued into the Pliocene. The late-stage deposition of the Ogallala was characterized by widespread fan deposition to an average thickness of 70 m and a maximum thickness of >200 m (Ryder, 1996). Significant deposition in the model (i.e., >30 m) occurs at distances of 300 km to 1200 km downstream from the Continental Divide and at elevations up to 1500 m, both similar to the actual Ogallala Formation. The model predicts a somewhat thinner deposit than observed, a difference that is likely due to the 2-D geometry of the model and to uncertainty in the value of m. A time-dependent three-dimensional depositional model is needed to refine the model predictions (see supplemental data for a discussion of the 2-D model results [footnote 1]). Sedimentation occurred throughout the southwestern U.S. and offshore from the late Miocene to the Pliocene (McMillan et al., 2006; Chapin, 2008; Galloway et al., 2000). The widespread nature of this sedimentation strongly suggests climate as the key driver (Chapin, 2008).
DISCUSSION AND CONCLUSIONS
Late Cenozoic river erosion triggered isostatic rock uplift throughout the region at distances of up to 300 km (i.e., a flexural wavelength) away from where significant erosion occurred. Leonard (2002) and McMillan et al. (2004) both used flexural-isostatic modeling to determine the causes of post-depositional tilting of the Ogallala Formation and concluded that isostasy could produce at most half of the estimated rock uplift. However, both studies neglect the unloading of the Colorado Front Range immediately to the west of the Great Plains. Given the sensitivity of flexural-isostatic calculations to the spatial distribution of unloading regionally (e.g., Pelletier, 2004), neglecting the unloading west of the Great Plains is unlikely to be valid to the extent required to distinguish between active and passive uplift scenarios.
The hypothesis of snowmelt-driven erosion is consistent with recent evidence that the seasonality of temperature influences erosion rates in the Bighorn and Powder River Basins. While the size of the snowpack exerts the principal control on the magnitude of snowmelt-driven erosion, warm-season temperatures also play a role because warmer temperatures lead to faster melting and hence more intense snowmelt-driven flooding. Heffern et al. (2007) and Riihimaki et al. (2008) documented higher rates of erosion and/or more frequent coal fires during periods of greater orbital eccentricity using the distribution of cooling ages in coal fires in these basins. While these data cannot be uniquely attributed to pulses of erosion, they are consistent with the snowmelt-driven erosion hypothesis.
Molnar and his colleagues documented an abrupt increase in sedimentation rates in many, though not all, depositional basins worldwide from 4 to 2 Ma (Zhang et al., 2001), including many low-latitude regions where late Cenozoic glaciation has not occurred. Sparser evidence also suggests a pulse beginning at 15 Ma (Molnar, 2004). Molnar and colleagues attributed these pulses primarily to an increase in the variability of global climate beginning at 15 and 42 Ma. The snowmelt-driven erosion hypothesis, however, provides a possible alternative explanation for the widespread increase in erosion rates.
ACKNOWLEDGMENTS
The idea for this project developed during an ExxonMobil field trip in the Bighorn Basin. I thank Lori Summa and Steve May for organizing the trip and for helpful conversations on the regional geology. In particular, the view illustrated in Figure 1 was a stop on that field trip. I also thank Pete Reiners and Pete Decelles for helpful conversations and Joel Johnson and an anonymous reviewer for their thoughtful comments that improved this paper.
REFERENCES CITED
- Chapin, C.E., 2008, Interplay of oceanographic and paleoclimate events with tectonism during middle to late Miocene sedimentation across the southwestern USA: Geosphere, v. 4, p. 976991, doi: 10.1130/GES00171.1.
- Crowley, P.D., Reiners, P.W., Reuter, J.M., and Kaye, G.D., 2002, Laramide exhumation of the Bighorn Mountains, Wyoming: An apatite (U-Th)/He thermochronology study: Geology, v. 30, p. 2730, doi: 10.1130/0091-7613(2002)030<0027:LEOTBM>2.0.CO;2.
- Dade, W.B., and Friend, P.F., 1998, Grain size, sediment-transport regime, and channel slope in alluvial rivers: The Journal of Geology, v. 106, p. 661675.
- Daly, C., Neilson, R.P., and Phillips, D.L., 1994, A statistical-topographic model for mapping climatological precipitation over mountainous terrain: Journal of Applied Meteorology, v. 33, p. 140158, doi: 10.1175/1520-0450(1994)033<0140:ASTMFM>2.0.CO;2.
- Dethier, D.P., 2001, Pleistocene erosion rates in the western United States calibrated using Lava Creek B tephra: Geology, v. 29, p. 783786, doi: 10.1130/0091-7613(2001)029<0783:PIRITW>2.0.CO;2.
- Dettman, D.L., and Lohmann, K.C., 2000, Oxygen isotope evidence for high-altitude snow in the Laramide Rocky Mountains of North America during the Late Cretaceous and Paleogene: Geology, v. 28, p. 243246, doi: 10.1130/0091-7613(2000)28<243:OIEFHS>2.0.CO;2.
- Diffendal, R.F., Jr., 1982, Regional implications of the geology of the Ogallala Group (upper Tertiary) of southwestern Morrill County, Nebraska, and adjacent areas: Geological Society of America Bulletin, v. 93, p. 964976, doi: 10.1130/0016-7606(1982)93<964:RIOTGO>2.0.CO;2.
- Dyer, J., 2008, Snow depth and streamflow relationships in large North American watersheds: Journal of Geophysical Research, v. 113, p. D18113, doi: 10.1029/2008JD010031.
- Eaton, G.P., 1987, Topography and origin of the southern Rocky Mountains and Alvarado Ridge, in Coward, M.P., et al., eds., Continental extensional tectonics: Geological Society of London Special Publication 28, p. 355369.
- Eaton, G.P., 2008, Epeirogeny in the Southern Rocky Mountains region: Evidence and origin: Geosphere, v. 4, no. 5, p. 764784, doi: 10.1130/GES00149.1.
- Emmett, W.W., and Wolman, M.G., 2001, Effective discharge and gravel-bed rivers: Earth Surface Processes and Landforms, v. 26, no. 13, p. 13691380, doi: 10.1002/esp.303.
- Epis, R.C., and Chapin, C.E., 1975, Geomorphic and tectonic implications of the post-Laramide late Eocene erosion surface in the southern Rocky Mountains, in Curtis, B.F., ed., Cenozoic history of the southern Rocky Mountains: Geological Society of America Memoir 144, p. 4574.
- Galloway, W.E., Ganey-Curry, P.E., Xiang, Li, and Buffler, R., 2000, Cenozoic depositional history of the Gulf of Mexico basin: AAPG Bulletin, v. 84, no. 11, p. 17431774.
- Gregory, K.M., and Chase, C.G., 1994, Tectonic and climatic significance of a late Eocene low-relief geomorphic surface, Colorado: Journal of Geophysical Research, v. 99, p. 20,14120,160, doi: 10.1029/94JB00132.
- Hancock, G.S., and Anderson, R.S., 2002, Numerical modeling of fluvial terrace formation in response to oscillating climate: Geological Society of America Bulletin, v. 114, no. 9, p. 11311142.
- Heasler, H.P., and Kharitonona, N.K., 1996, Analysis of sonic well logs applied to erosion estimates in the Bighorn Basin, Wyoming: AAPG Bulletin, v. 80, no. 5, p. 630646.
- Heffern, E.L., Reiners, P.W., Naeser, C.W., and Coates, D.A., 2007, Geochronology of clinker and implications for evolution of the Powder River Basin landscape, Wyoming and Montana: Geological Society of America Reviews in Engineering Geology 18, p. 155175.
- Izett, G.A., 1975, Late Cenozoic sedimentation and deformation in northern Colorado and adjoining areas, in Curtis, B.F., ed., Cenozoic history of the southern Rocky Mountains: Geological Society of America Memoir 144, p. 179209.
- Karlstrom, K.E., Crow, R., Crossey, L.J., Coblentz, D., and van Wijk, J.W., 2008, Model for tectonically driven erosion of the younger than 6 Ma Grand Canyon: Geology, v. 36, p. 835838, doi: 10.1130/G25032A.1.
- Kent-Corson, M.L., Sherman, L.S., Mulch, A., and Chamberlain, C.P., 2006, Cenozoic topographic and climatic response to changing tectonic boundary conditions in Western North America: Earth and Planetary Science Letters, v. 252, no. 34, p. 453466, doi: 10.1016/j.epsl.2006.09.049.
- Kettner, A.J., and Syvitski, J.P.M., 2008, HydroTrend v.3.0: A climate-driven hydrological transport model that simulates discharge and sediment load leaving a river system: Computers & Geosciences, v. 34, p. 11701183, doi: 10.1016/j.cageo.2008.02.008.
- Leonard, E.M., 2002, Geomorphic and tectonic forcing of late Cenozoic warping of the Colorado piedmont: Geology, v. 30, p. 595598, doi: 10.1130/0091-7613(2002)030<0595:GATFOL>2.0.CO;2. Mackin, J.H., 1937, Erosional history of the Big Horn Basin, Wyoming: Geological Society of America Bulletin, v. 48, p. 813893.
- McMillan, M.E., Angevine, C.L., and Heller, P.L., 2004, Postdepositional tilt of the Miocene-Pliocene Ogallala Group on the western Great Plains: Evidence of late Cenozoic uplift of the Rocky Mountains: Geology, v. 30, p. 6366, doi: 10.1130/0091-7613(2002)030<0063:PTOTMP>2.0.CO;2.
- McMillan, M.E., Heller, P.L., and Wing, S.L., 2006, History and causes of post-Laramide relief in the Rocky Mountain orogenic plateau: Geological Society of America Bulletin, v. 118, p. 393405, doi: 10.1130/B25712.1.
- Merz, R., Bloschl, G., and Parajka, J., 2006, Spatio-temporal variability of event runoff coefficients: Journal of Hydrology, v. 331, p. 591604, doi: 10.1016/j.jhydrol.2006.06.008.
- Molnar, P., 2001, Climate change, flooding in arid environments, and erosion rates: Geology, v. 29, no. 12, p. 10711074, doi: 10.1130/0091-7613(2001)029<1071:CCFIAE>2.0.CO;2.
- Molnar, P., 2004, Late Cenozoic increase in accumulation rates of terrestrial sediment: How might climate change have affected erosion rates?: Annual Review of Earth and Planetary Sciences, v. 32, p. 6789, doi: 10.1146/annurev.earth.32.091003.143456.
- Molnar, P., Anderson, R.S., Kier, G., and Rose, J., 2006, Relationships among probability distributions of stream discharges in floods, climate, bed load transport, and river erosion: Journal of Geophysical Research, v. 111, F02001, doi: 10.1029/2005JF000310.
- Mulch, A., Teyssier, C., Cosca, M.A., Vanderhaeghe, O., and Venneman, T.W., 2004, Reconstructing paleoelevation in eroded orogens: Geology, v. 32, no. 6, p. 525528, doi: 10.1130/G20394.1.
- Naeser, C.W., Izett, G.A., and Obradovich, J.D., 1980, Fission-track and K-Ar ages of natural glasses: U.S. Geological Survey Bulletin 1489, 31 p.
- Paola, C., Heller, P.L., and Andgevine, C.L., 1992, The large-scale dynamics of the grain-size variation in the alluvial basins, 1: Theory: Basin Research, v. 4, p. 7390.
- Pederson, J.L., Mackley, R.D., and Eddleman, J.L., 2002, Colorado Plateau uplift and erosion evaluated using GIS: GSA Today, v. 12, no. 8, p. 410, doi: 10.1130/1052-5173(2002)012<0004:CPUAEE>2.0.CO;2.
- Pelletier, J.D., 2004, Estimate of three-dimensional flexural-isostatic response to unloading: Rock uplift due to late Cenozoic glacial erosion in the western United States: Geology, v. 32, p. 161164, doi: 10.1130/G20059.1.
- Riihimaki, C.A., Anderson, R.S., and Safran, E.B., 2007, Impact of rock uplift on rates of late Cenozoic Rocky Mountain river erosion: Journal of Geophysical Research, Earth Surface, v. 112, F03S02, doi: 10.1029/2006JF000557.
- Riihimaki, C.A., Reiners, P.W., and Heffern, E.L., 2008, Evidence for climatic control on Quaternary landscape evolution in the central Rocky Mountains: Eos (Transactions, American Geophysical Union), v. 89, no. 53, abs. H53B-1016.
- Ryder, P.D., 1996, Ground Water Atlas of the United States: Oklahoma and Texas: Hydrological Atlas 730-E: Online publication available at http://pubs.usgs.gov/ha/ha730/ch_e/E-text5.html (last accessed 3 Jan. 2009).
- Small, E.E., Anderson, R.S., Repka, J.L., and Finkel, R., 1997, Erosion rates of alpine bedrock summit surfaces deduced from in situ 10Be and 26Al: Earth and Planetary Science Letters, v. 150, p. 413425, doi: 10.1016/S0012-821X(97)00092-7.
- Trimble, D.E., 1980, Cenozoic history of the Great Plains contrasted with that of the southern Rocky Mountains: A synthesis: The Mountain Geologist, v. 17, p. 5969.
- Troendle, C.A., Nankervis, J.M., and Ryan, S.E., 1996, Sediment transport from small, steep-gradient watersheds in Colorado and Wyoming, in Sedimentation Technologies for Management of Natural Resources in the 21st Century: Sixth Federal Interagency Sedimentation Conference, 1014 March 1996, Las Vegas, Nevada, p. IX-39IX-45.
- Wolfe, J.A., Forest, C.E., and Molnar, P., 1998, Paleobotanical evidence of Eocene and Oligocene paleoaltitudes in midlatitude western North America: Geological Society of America Bulletin, v. 110, p. 664678, doi: 10.1130/0016-7606(1998)110<0664:PEOEAO>2.3.CO;2.
- Wolman, M.G., and Miller, J.P., 1960, Magnitude and frequency of forces in geomorphic processes: The Journal of Geology, v. 68, p. 5474. Young, R.A., 2008, Pre-Colorado River drainage in western Grand Canyon: Potential influence on Miocene stratigraphy in Grand Wash trough, in Reheis, M.C., Hershler, R., and Miller, D.M., eds., Late Cenozoic drainage history of the Southwestern Great Basin and lower Colorado region: Geologic and biotic perspective: Geological Society of America Special Paper 439, p. 319334.
- Zaprowski, B.J., Evenson, E.B., Pazzaglia, F.J., and Epstein, J.B., 2001, Knickzone propagation in the Black Hills and northern High Plains: A different perspective on the late Cenozoic exhumation of the Laramide Rocky Mountains: Geology, v. 29, p. 547550, doi: 10.1130/0091-7613(2001)029<0547:KPITBH>2.0.CO;2.
- Zaprowski, B.J., Pazzaglia, F.J., and Evenson, E.B., 2005, Climatic influences of profile concavity and river erosion: Journal of Geophysical Research, v. 110, p. F03004, doi: 10.1029/2004JF000138.
- Zhang, P., Molnar, P., and Downs, W.R., 2001, Increased sedimentation rates and grain sizes 24 Myr ago due to the influence of climate change on erosion rates: Nature, v. 410, p. 599604, doi: 10.1038/35069099.
1 GSA supplemental data item 2009162, further discussion and model results for snowmelt-driven erosion, is available at the GSA Data Repository; copies may also be requested from .