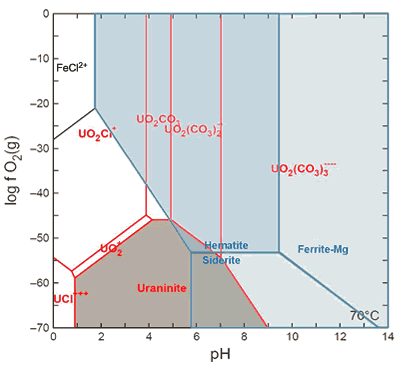
Figure 3.
The stability fields of different U-species (red lines), shown as a function of pH and ƒO2 calculated assuming T = 70 °C, ƒCO2 = 5 atm, and modern seawater concentrations for the major ions. In modeling this phase diagram, uranium activity of 10 nmol/L and Fe activity of 50 μmol/L were used to reflect increased Fe solubility in the anoxic Archean ocean. The stability fields of Fe-species is overlain (separated by blue lines), with the stability fields of the minerals hematite, siderite, and Mg-ferrite shaded in blue. Note the predicted mobility of U with increasing ƒO2 while Fe, a potential neutron absorber, remains in the solid phase for pH >5.8.