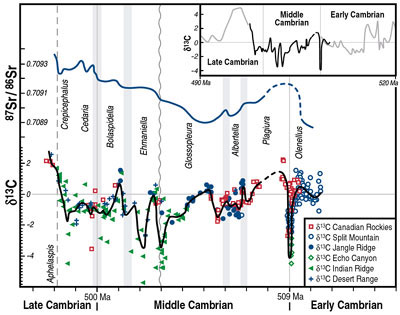
Figure 4. Secular variation in d13C values of samples used for Sr isotope analysis, as well as additional samples, that passed our petrographic and geochemical screening criteria for retaining primary marine d13C values but did not pass the criteria for Sr isotope analysis. Black curve is a five-point running average of d13C values; blue curve is five-point running average of 87Sr/86Sr values. Inset curve shows best estimate of seawater secular C isotope curve for Cambrian Period based on compilation of data from this study (bold) and data presented in Brasier and Sukhov (1998). Carbon isotope analyses were conducted at University of Southern California, University of Texas at Austin, and University of California, Davis. External precision (1 s) for d13C was ±0.05‰.