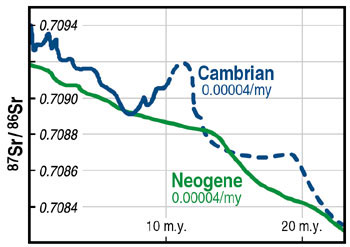
Figure 3. Comparison of seawater Sr isotope curves for latest Early through early Late Cambrian time with the late Cenozoic Sr curve (DePaolo and Ingram, 1985). Long-term rates of rise through ~23 m.y. period are comparable, but Cambrian rise is characterized by superimposed shorter term 87Sr/86Sr fluctuations, and reaches peak 87Sr/86Sr values that are unmatched in Phanerozoic time.