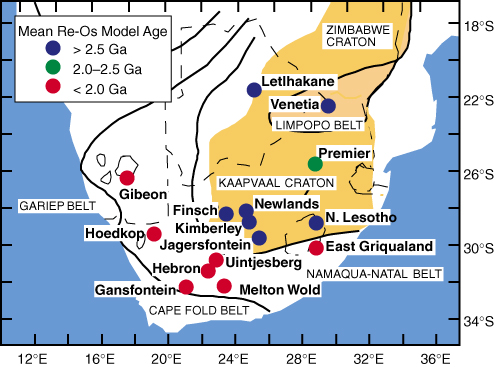
Figure 4. Map of southern Africa showing mean Re-depletion model ages measured for peridotite xenoliths from kimberlites erupted on- and off-craton. Each large circle is an individual kimberlite locality from which several xenoliths have been analyzed. Extent of Archean crust is outlined in yellow, brown is Limpopo metamorphic belt. Data from Pearson et al. (1995, 1998a), Carlson et al. (1999), Janney et al. (1999), and Pearson (1999).