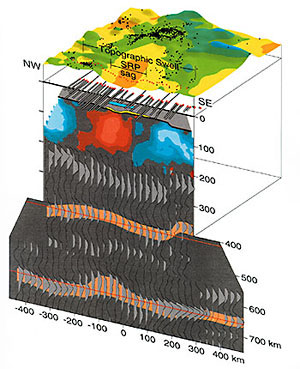
Figure 3. Seismic structure beneath Yellowstone swell. View is to north. High topography (green) correlates with local seismicity (black dots) and defines hotspot swell. Teleseismic studies derived from data collected by seismometers crossing swell (red dots) image: (1) crust that is not greatly thickened beneath Snake River Plain (SRP) (Moho shown with heavy line near 40 km depth), in spite of intrusion of high-velocity mid-crustal basalt sill (blue) and partially molten underplate (yellow); (2) high-velocity mantle (blue) beneath higher elevations and low-velocity mantle (red) beneath depressed SRP (contour level is 1% in P-wave velocity); (3) split SKS waves indicating anisotropic mantle with a fast-axis orientation oriented to the southwest (black and white bars show split times of 0.6Ð1.6 s; black bars show unsplit arrivals that were naturally polarized in the direction of the bar); and (4) undulatory 410 km and 660 km interfaces (highlighted in salmon color). These imply: (1) that mantle is approximately uniformly buoyant across entire swell; (2) upper 200 km of mantle is partially molten beneath SRP and depleted of basaltic component elsewhere beneath swell; (3) upper few hundred km of mantle has been simply sheared with a southwest-northeast finite extension direction; and (4) mantle beneath SRP is anomalously hot beneath SRP at 660 km, but appears to be cool at 410 km.