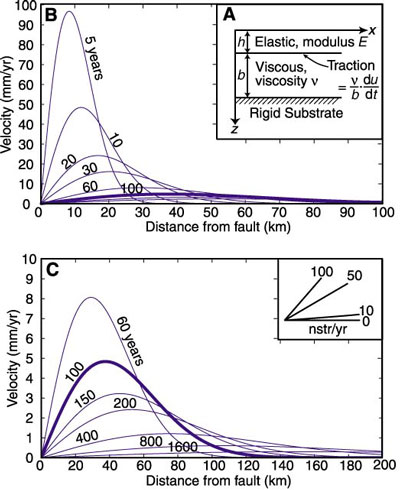
Figure 5. A: Diagram showing model for horizontal surface motion of transient waves after an earthquake in a brittle layer overlying a viscous layer on a rigid substrate (after Foulger et al., 1992). B and C: Evolution of horizontal velocity field normal to fault trace following a normal fault earthquake, with Uo = 2 m, Young's modulus E = 0.5 × 10¹¹ Pa, viscosity n = 5 × 10¹⁹ Pa • s, and layer thicknesses b and h 15 km each, as may be appropriate for the Basin and Range. Plots show two separate time and length scales for same model.