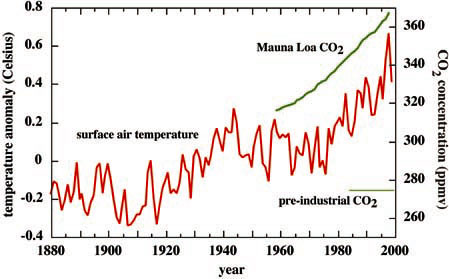
Figure 2. Red curve shows annual global mean surface-air temperature for the period 1880-1999, obtained from U.S. National Climatic Data Center. The mean temperature for period of record has been removed. Thick green curve shows annual mean concentration of CO2 (ppmv) for the period 1959-1999, sampled at Mauna Loa Observatory, Hawaii (Keeling and Whorf, 1999). The preindustrial CO2 concentration of about 275 ppmv is marked by lighter green line.