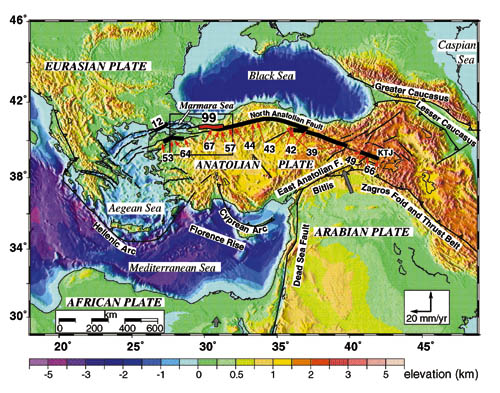
Figure 1. Simplified tectonic map of eastern Mediterranean superimposed on topography and bathymetry. Solid lines-strike-slip faults; lines with tick marks-normal faults, ticks on down-thrown block; lines with triangles-thrust faults, triangles on overriding block. Large gray arrows show NUVEL-1A estimates for Africa and Arabia motion relative to Eurasia (DeMet et al., 1994). Heavy dark lines indicate segments of North Anatolian fault zone that showed coseismic surface breaks; red arrows indicate approximate limit of breaks for each event in year indicated (i.e., 44 = 1944). Heavy red line shows location of the 1999 Izmit and Duzce earthquake surface breaks (November 12, 1999, Duzce event, M = 7.1, ruptured easternmost 30-40 km segment shown in red). Area enclosed by rectangle is shown in Figure 4. KTJ-Karliova triple junction.